PLACES_COUNT_PER_H3 函式會採用要搜尋的地理區域,並傳回搜尋區域中每個 H3 格子的地點數量表格。
由於 PLACES_COUNT_PER_GEO 函式會傳回資料表,請使用 FROM 子句呼叫該函式。
輸入參數:
傳回:
- 表格,每個 H3 儲存格各占一行。這個資料表包含資料欄
h3_cell_index(STRING)、geography(GEOGRAPHY),用於定義代表 H3 儲存格的多邊形、count(INT64) 和place_ids(ARRAY<STRING>),其中place_ids最多可包含每個 H3 儲存格的 250 個地點 ID。
- 表格,每個 H3 儲存格各占一行。這個資料表包含資料欄
示例:計算每個 H3 格子內有無障礙設施的便利商店和雜貨店數量
以下範例會計算紐約市每個 H3 儲存格中,可供輪椅通行的營業中便利商店和雜貨店數量。H3 儲存格使用解析度層級 8。
這個範例會使用 Overture 地圖資料 BigQuery 公開資料集,取得紐約市的地理位置。
DECLARE geo GEOGRAPHY;

-- Get the geography for New York City.
SET geo = (SELECT geometry FROM `bigquery-public-data.overture_maps.division_area`
  WHERE country = 'US' AND names.primary = 'City of New York'  LIMIT 1);

SELECT * FROM `PROJECT_NAME.places_insights___us.PLACES_COUNT_PER_H3`(
  JSON_OBJECT(
      'geography', geo,
      'types', ["convenience_store","grocery_store"],
      'wheelchair_accessible_entrance', true,
      'business_status', ['OPERATIONAL'],
      'h3_resolution', 8
    )
);
函式的回應:
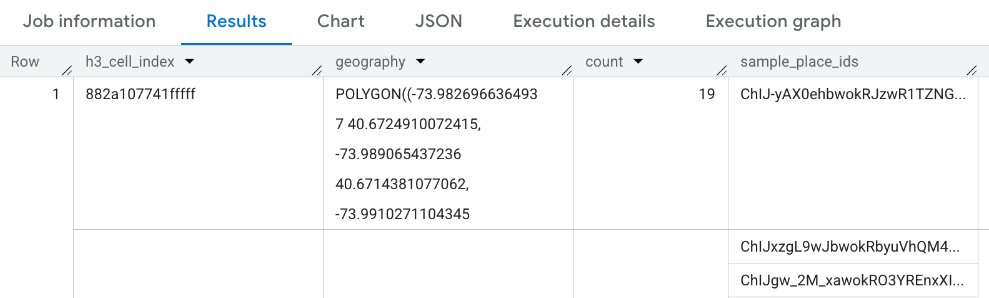
以視覺化方式呈現結果
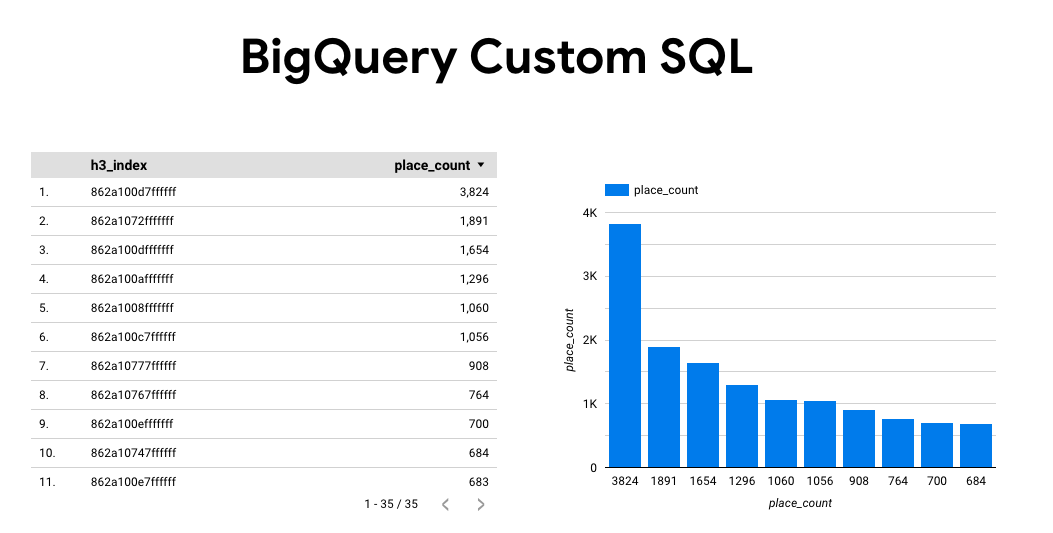
下圖顯示 Looker Studio 中的資料,以填滿地圖的形式呈現。 H3 格越深色,結果濃度就越高:

如要將資料匯入 Looker Studio,請按照下列步驟操作:
執行上述函式,即可產生結果。
在 BigQuery 結果中,依序點選「開啟方式」->「Looker Studio」。系統會自動將結果匯入 Looker Studio。
Looker Studio 會建立預設報表頁面,並以結果的標題、表格和長條圖初始化該頁面。
選取網頁上的所有內容並刪除。
按一下「插入」->「填滿地圖」,即可在報表中加入填滿地圖。
在「圖表類型 -> 設定」下方,設定欄位,如下所示:
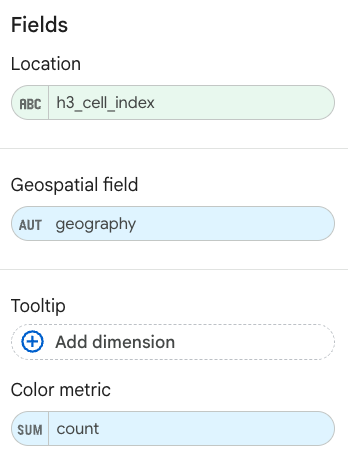
填滿的地圖會如上所示。您可以視需要選取「圖表類型」->「樣式」,進一步設定地圖外觀。
如要進一步瞭解如何以視覺化方式呈現地點洞察結果,請參閱「以視覺化方式呈現查詢結果」。