heatmapTiles 端点通过图块叠加提供与花粉相关的热图。图块叠加层是一组可显示在 Google 地图顶部的图像图块。每个图片图块的大小为 256 x 256 像素。
图块叠加层是由一组图块组装而成的网格,每个图块都分配有 (X,Y) 坐标。坐标为 (0,0) 的图块始终位于地图的西北角。X 值从西向东增加,而 Y 值从北向南增加。
zoom level 决定了地图视图中地图内容的大小。图块网格大小是通过按缩放级别以指数方式缩放 X 和 Y 坐标来确定的。
gridSizeX = XzoomLevel
gridSizeY = YzoomLevel
例如,在缩放级别为 2 时,世界地图使用 4x4 矩阵表示,总共有 16 个图块。
下图显示了整个世界的 TREE_UPI 热力图,该热力图分为多个图块,可在缩放级别为 2 时访问。

如需了解详情,请参阅地图和图块坐标。
您可以通过向以下网址发送 HTTP GET 请求,使用 heatmapTiles 端点请求当前的花粉热力图图块:
https://pollen.googleapis.com/v1/mapTypes/TYPE/heatmapTiles/Z/X/Y?key=YOUR_API_KEY
关于热图端点
成功发出请求需要提供以下所有参数:
KEY:应用的 API 密钥。此密钥用于标识您的应用,以便进行配额管理。了解如何获取密钥。TYPE:要返回的热图的类型。请参阅允许的值。Z:缩放级别,用于确定地图视图中地图内容的大小。允许的值为 0-16,其中值 0 表示使用单个图块显示整个世界。X、Y:相对于东北角 (0,0) 的图块坐标。X值从西向东增加,Y值从北向南增加。坐标必须对指定的缩放级别有效。例如,如果您将缩放级别设置为 2,并请求坐标为 (10,10) 的图块,则 API 会返回错误。
热图请求示例
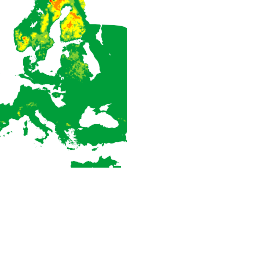
上图显示了缩放级别为 2 的 TREE_UPI 热图,以及每个图块的坐标。以下示例使用 heatmapTiles 端点请求坐标 (2,1) 处的图块:
https://pollen.googleapis.com/v1/mapTypes/TREE_UPI/heatmapTiles/2/2/1?key=YOUR_API_KEY
图块以可叠加在地图上的图片形式显示:
如需详细了解如何在默认地图上叠加图块,请参阅叠加地图类型。