- Dataset Availability
- 2000-02-26T00:00:00Z–2023-12-27T00:00:00Z
- Dataset Provider
- PML_V2
- Earth Engine Snippet
-
ee.ImageCollection("CAS/IGSNRR/PML/V2_v018") - Tags
Description
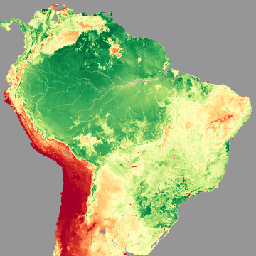
Penman-Monteith-Leuning Evapotranspiration V2 (PML_V2) products include evapotranspiration (ET), its three components, and gross primary product (GPP) at 500m and 8-day resolution during 2000-2023 and with spatial range from -60°S to 90°N. The major advantages of the PML_V2 products are:
- Coupled estimates of transpiration and GPP via canopy conductance (Gan et al., 2018; Zhang et al., 2019)
- Partitioning ET into three components: transpiration from vegetation, direct evaporation from the soil, and vaporization of intercepted rainfall from vegetation (Zhang et al., 2016).
The PML_V2 products perform well against observations at 95 flux sites across globe, and are similar to or noticeably better than major state-of-the-art ET and GPP products widely used by water and ecology science communities (Zhang et al., 2019).
Key changes in v0.1.8 compared with the original v0.1.4:
- Temporal coverage is lengthened to the latest (may update annually) with the MODIS C6.1 data.
- MODIS Terra LAI (MOD15A2H) is used rather than the composite LAI (MCD15A3H).
- Parameters are recalibrated with the change in LAI, while other forcings remain the same.
Bands
Resolution
500 meters
Bands
| Name | Units | Min | Max | Description |
|---|---|---|---|---|
GPP |
gC m-2 d-1 | 0* | 39.01* | Gross primary product |
Ec |
mm/d | 0* | 15.33* | Vegetation transpiration |
Es |
mm/d | 0* | 8.2* | Soil evaporation |
Ei |
mm/d | 0* | 12.56* | Interception from vegetation canopy |
ET_water |
mm/d | 0* | 20.11* | Water body, snow and ice evaporation. Penman evapotranspiration is regarded as actual evaporation for them. |
Terms of Use
Terms of Use
Acknowledgements
Whenever PML datasets are used in a scientific publication, the given references should be cited.
License
The dataset is licensed under the CC-BY 4.0 license.
Citations
Zhang, Y., Kong, D., Gan, R., Chiew, F.H.S., McVicar, T.R., Zhang, Q., and Yang, Y., 2019. Coupled estimation of 500m and 8-day resolution global evapotranspiration and gross primary production in 2002-2017. Remote Sens. Environ. 222, 165-182, doi:10.1016/j.rse.2018.12.031
Gan, R., Zhang, Y.Q., Shi, H., Yang, Y.T., Eamus, D., Cheng, L., Chiew, F.H.S., Yu, Q., 2018. Use of satellite leaf area index estimating evapotranspiration and gross assimilation for Australian ecosystems. Ecohydrology, doi:10.1002/eco.1974
Zhang, Y., Peña-Arancibia, J.L., McVicar, T.R., Chiew, F.H.S., Vaze, J., Liu, C., Lu, X., Zheng, H., Wang, Y., Liu, Y.Y., Miralles, D.G., Pan, M., 2016. Multi-decadal trends in global terrestrial evapotranspiration and its components. Sci. Rep. 6, 19124. doi:10.1038/srep19124
DOIs
Explore with Earth Engine
Code Editor (JavaScript)
var dataset = ee.ImageCollection('CAS/IGSNRR/PML/V2_v018');

var visualization = {
  bands: ['GPP'],
  min: 0.0,
  max: 9.0,
  palette: [
    'a50026', 'd73027', 'f46d43', 'fdae61', 'fee08b', 'ffffbf',
    'd9ef8b', 'a6d96a', '66bd63', '1a9850', '006837',
  ]
};

Map.setCenter(0.0, 15.0, 2);

Map.addLayer(
    dataset.first(), visualization, 'PML_V2 0.1.8 Gross Primary Product (GPP)');