이 데이터 세트에는 ECMWF 통합 예측 시스템 (IFS)에서 0.25도 해상도로 생성한 파도 모델 필드의 6일 예측이 포함되어 있습니다.
ECMWF 실시간 예측 데이터(이 데이터는 그 하위 집합임)가 출시된 후 하루에 두 번 새 제품이 출시되므로 이를 준실시간(NRT)이라고 합니다. 이는 '단기 컷오프' 스트림으로, 예측 범위가 표준 IFS WAVE 예측보다 짧습니다. 적절한 저작자 표시가 있는 경우 데이터를 배포하고 상업적으로 사용할 수 있습니다.
제품은 2024년 11월 12일에 Cycle 49r1이 구현된 이후부터 Earth Engine에서 사용할 수 있습니다. 이전 제품은 포함되지 않습니다. ECMWF NRT 데이터 세트 사용 방법에 관한 일반 정보는 사용자 문서를 참고하세요.
소스 파일은 Google Cloud Marketplace에서 확인할 수 있습니다.
[null,null,[],[],[],null,["Dataset Availability\n: 2024-11-12T18:00:00Z--2025-09-02T18:00:00Z\n\nDataset Provider\n:\n\n\n [ECMWF](https://www.ecmwf.int/en/forecasts/datasets/open-data)\n\nCadence\n: 12 Hours\n\nTags\n:\n[climate](/earth-engine/datasets/tags/climate) [ecmwf](/earth-engine/datasets/tags/ecmwf) [forecast](/earth-engine/datasets/tags/forecast) [global](/earth-engine/datasets/tags/global) [ocean](/earth-engine/datasets/tags/ocean) \n\nDescription \nThis dataset contains 6-day forecasts of the wave model fields generated by\nthe ECMWF Integrated Forecasting System (IFS) at 0.25 degree resolution.\nWe refer to these as Near-Realtime (NRT) because new products are released\ntwice a day after the release of the ECMWF realtime forecast data, of which\nthis is a subset. This is a \"Short-Cutoff\" stream, meaning the forecasts\nhave a shorter range than the standard IFS WAVE forecasts. Data may be\ndistributed and used commercially with\n[proper attribution](https://apps.ecmwf.int/datasets/licences/general/).\n\nProducts are available in Earth Engine starting with the implementation of\n[Cycle 49r1](https://confluence.ecmwf.int/display/FCST/Implementation+of+IFS+Cycle+49r1)\non 2024-11-12; earlier products are not included. For general information\nabout how to use ECMWF NRT datasets, see their\n[user documentation](https://confluence.ecmwf.int/display/DAC/ECMWF+open+data%3A+real-time+forecasts+from+IFS+and+AIFS).\nSources files are available in the\n[Google Cloud marketplace](https://console.cloud.google.com/marketplace/product/bigquery-public-data/open-data-ecmwf).\n\nBands\n\n\n**Pixel Size**\n\n28000 meters\n\n**Bands**\n\n| Name | Units | Min | Max | Pixel Size | Description |\n|-----------------------------------------------------------|---------|-------------|-----------|------------|------------------------------------------------------------------------------------------------------------------------------------------------------------------------------------------------------------------------------------------------|\n| `mean_zero_crossing_wave_period_sfc` | seconds | 0.889602\\* | 17.573\\* | meters | The mean length of time between occasions where the sea/ocean surface crosses mean sea level. |\n| `significant_height_of_combined_wind_waves_and_swell_sfc` | m | 0.0172079\\* | 15.5856\\* | meters | The average height of the highest third of surface ocean/sea waves generated by wind and swell. It represents the vertical distance between the wave crest and the wave trough. |\n| `mean_wave_direction_sfc` | deg | 0 | 360 | meters | The mean direction of ocean/sea surface waves relative to the geographic location of the north pole (e.g., 0 means \"coming from the north\" and 90 \"coming from the east\"). |\n| `peak_wave_period_sfc` | seconds | 1.03074\\* | 23.7889\\* | meters | The period of the most energetic ocean waves generated by local winds and associated with swell. The wave period is the average time it takes for two consecutive wave crests, on the surface of the ocean/sea, to pass through a fixed point. |\n| `mean_wave_period_sfc` | seconds | 1.04148\\* | 18.3643\\* | meters | The average time it takes for two consecutive wave crests, on the surface of the ocean/sea, to pass through a fixed point. |\n\n\\* estimated min or max value\n\nImage Properties\n\n**Image Properties**\n\n| Name | Type | Description |\n|----------------|--------|---------------------------------------------------------------------------------------------------------------------------------|\n| creation_day | INT | Day of the month when the forecast was created. |\n| creation_doy | INT | Day of the year when the forecast was created. |\n| creation_hour | INT | Hour of the day when the forecast was created. |\n| creation_month | INT | Month of the year when the forecast was created. |\n| creation_time | INT | Time, in unix epoch milliseconds, when forecast was created. |\n| creation_year | INT | Year when the forecast was created. |\n| forecast_hours | INT | Hours into the future, relative to `creation_time`, of the forecast. |\n| forecast_time | INT | Time, in unix epoch milliseconds, of the forecast. |\n| model | STRING | The ECMWF forecasting model: - ifs: Integrated Forecasting System - aifs: Artificial Intelligence/Integrated Forecasting System |\n| stream | STRING | The stream from which the variables were fetched. See the full list [here](https://codes.ecmwf.int/grib/format/mars/stream/). |\n\nTerms of Use\n\n**Terms of Use**\n\n[CC-BY-4.0](https://spdx.org/licenses/CC-BY-4.0.html)\n\nDOIs\n\n- \u003chttps://doi.org/10.21957/open-data\u003e\n\nExplore with Earth Engine **Important:** Earth Engine is a platform for petabyte-scale scientific analysis and visualization of geospatial datasets, both for public benefit and for business and government users. Earth Engine is free to use for research, education, and nonprofit use. To get started, please [register for Earth Engine access.](https://console.cloud.google.com/earth-engine)\n\nCode Editor (JavaScript) \n\n```javascript\n
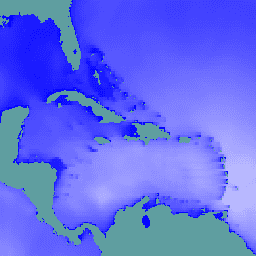
// Observe the ocean in the vicinity of the Caribbean islands and\n// Gulf coast.\nvar aoi = ee.Geometry.Polygon(\n [[\n [-100.6052734375, 31.751243295508836],\n [-100.6052734375, 6.080143483787566],\n [-57.18730468750001, 6.080143483787566],\n [-57.18730468750001, 31.751243295508836]\n ]],\n null, false);\n\n// Extract significant wave height forecasts made at noon on 2025/6/11.\nvar wave =\n ee.ImageCollection('ECMWF/NRT_FORECAST/IFS/WAVE')\n .filter(ee.Filter.eq('creation_doy', 162))\n .filter(ee.Filter.eq('creation_hour', 12))\n .sort('forecast_hours')\n .select('significant_height_of_combined_wind_waves_and_swell_sfc');\n\n// Display the observations at forecast hour 0 on the map.\nvar hour0 = wave.first().clip(aoi);\nMap.centerObject(hour0);\nMap.addLayer(hour0, {min: 0, max: 5}, 'sig height fc=0');\n\n// Animate the wave height forecasts over time.\nvar videoArgs = {\n dimensions: 540,\n region: aoi,\n framesPerSecond: 7,\n crs: 'EPSG:3857',\n min: 0,\n max: 5,\n};\nprint(ui.Thumbnail(wave, videoArgs));\n```\n[Open in Code Editor](https://code.earthengine.google.com/?scriptPath=Examples:Datasets/ECMWF/ECMWF_NRT_FORECAST_IFS_SCWV) \n[ECMWF Near-Realtime IFS Wave (Short-Cutoff) Forecasts](/earth-engine/datasets/catalog/ECMWF_NRT_FORECAST_IFS_SCWV) \nThis dataset contains 6-day forecasts of the wave model fields generated by the ECMWF Integrated Forecasting System (IFS) at 0.25 degree resolution. We refer to these as Near-Realtime (NRT) because new products are released twice a day after the release of the ECMWF realtime forecast data, of which this is ... \nECMWF/NRT_FORECAST/IFS/SCWV, climate,ecmwf,forecast,global,ocean \n2024-11-12T18:00:00Z/2025-09-02T18:00:00Z \n-90 -180 90 180 \nGoogle Earth Engine \nhttps://developers.google.com/earth-engine/datasets\n\n- [https://doi.org/10.21957/open-data](https://doi.org/https://www.ecmwf.int/en/forecasts/datasets/open-data)\n- [https://doi.org/10.21957/open-data](https://doi.org/https://developers.google.com/earth-engine/datasets/catalog/ECMWF_NRT_FORECAST_IFS_SCWV)"]]