- Dataset Availability
- 2021-08-07T00:00:00Z–2021-08-11T00:00:00Z
- Dataset Provider
- Environmental Defense Fund - MethaneSAT
- Earth Engine Snippet
-
ee.Image("EDF/MethaneSAT/MethaneAIR/methaneair-L4area-2021") - Tags
Description
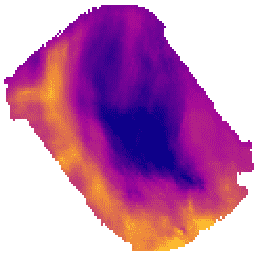
The area emissions model is still in development and not representative of a final product.
This dataset provides high-resolution, spatially disaggregated methane emission fluxes (kg/hr) of the Permian Delaware sub-basin in southern New Mexico and western Texas as well as for the Uinta basin in Utah.
Methane is a potent greenhouse gas that has more than 80 times the warming power of carbon dioxide over the first 20 years after it reaches the atmosphere. At least 30% of today's global warming is driven by methane from human actions. Cutting methane emissions associated with human activities - including avoidable emissions from oil and gas operations, agriculture, and waste management - is the single fastest way to slow the rate of global warming.
This dataset was generated using MethaneAIR measurements taken on 8 August 2021 (research flight RF06) over the Permian and 11 August 2021 (RF08) over Uinta. MethaneAIR is an airborne precursor of the MethaneSAT satellite mission, managed by MethaneSAT LLC, a wholly owned subsidiary of Environmental Defense Fund. The methane emission fluxes were produced using a geostatistical inverse modeling framework specialized to exploit the high spatial resolution, wide spatial coverage, and high precision of MethaneAIR data.
For additional information about the MethaneAIR instrument, instrument calibration and emission detections, please refer to recent publications by Staebell et al. (2021), Conway et al. (2023), Chulakadabba et al. (2023), Abbadi et al. (2023), Omara et al. (2023), and Miller et al. (2023).
Contact the data provider for more information about the project at this link: https://www.methanesat.org/contact/
Bands
Bands
| Name | Units | Min | Max | Pixel Size | Description |
|---|---|---|---|---|---|
flux |
kg/h/km^2 | 0* | 22.89* | 1000 meters | Methane emissions traceable to a 1km^2 area. |
Terms of Use
Terms of Use
Use of this data is subject to MethaneSAT's Content License Terms of Use.
Explore with Earth Engine
Code Editor (JavaScript)
var dataset = ee.Image("EDF/MethaneSAT/MethaneAIR/methaneair-L4area-2021");

var fluxVisParams = {
  min: 0,
  max: 24,
  palette: ['#070088','#a3069b','#cc4e64','#ffa826','#edfb59'],
};

// Center on one of the two available areas of interests.
// Map.setCenter(-109.6, 40, 9)
Map.setCenter(-103.71, 31.96, 9);
Map.addLayer(dataset, fluxVisParams, 'Methane area sources flux');