এই বৃহৎ ভেক্টর ডেটাসেটে ক্যালিফোর্নিয়ায় জুন 2015 এবং জুন 2019 এর মধ্যে NO, NO2, O3, CH4, CO2, BC, PN2.5 এবং UFP ঘনত্বের উচ্চ রেজোলিউশনের বায়ু দূষণ ম্যাপিং রয়েছে৷
ডেটাসেটে 2015-05-28 থেকে 2019-06-07 পর্যন্ত অ্যাকলিমা মোবাইল পরিমাপ এবং ডেটা ইন্টিগ্রেশন প্ল্যাটফর্মের সাথে সজ্জিত চারটি Google রাস্তার দৃশ্য গাড়ি ব্যবহার করে সংগৃহীত পরিমাপ রয়েছে। সমস্ত চারটি গাড়িই পুরো সময়সীমায় সক্রিয়ভাবে ম্যাপিং করা হয়নি। মনে রাখবেন যে যখন একটি পৃথক গাড়ি অপারেশনাল, যান্ত্রিক বা সিস্টেমের অসুবিধার কারণে ম্যাপিং করা হয়নি তখন ডেটাতে ফাঁক থাকতে পারে।
চারটি গাড়ির প্রতিটির অপারেশনের তারিখ:
গাড়ী A: 2016-05-03 - 2019-04-30
কার বি: 2016-05-03 - 2018-06-08
কার সি: 2015-05-28 - 2019-06-07
কার ডি: 2015-06-24 - 2018-11-05
সান ফ্রান্সিসকো বে এরিয়া, লস অ্যাঞ্জেলেস এবং উত্তর সান জোয়াকিন ভ্যালি সহ ক্যালিফোর্নিয়ার বিভিন্ন ভৌগলিক অঞ্চলে ডেটা সংগ্রহ করা হয়েছিল। ম্যাপিং এই অঞ্চলের মধ্যে টার্গেটেড আশেপাশের বা শহরগুলিতে ঘটেছে৷ ডেটা সেটটিতে "ক্যালিফোর্নিয়া_ইউনিফাইড_2015_2019" শিরোনামের একটি টেবিল রয়েছে যা দূষক ওজোন (O3), নাইট্রোজেন ডাই অক্সাইড (NO2), নাইট্রোজেন মনোক্সাইড (NO), মিথেন (CH4), কার্বন ডাই অক্সাইড (CO2), কালো কার্বন (BC), কণার ঘনত্ব নিয়ে গঠিত। আল্ট্রাফাইন পার্টিকেলস (UFP) দ্রুত সময়-প্রতিক্রিয়া, ল্যাবরেটরি-গ্রেড যন্ত্র দিয়ে সজ্জিত চারটি Google রাস্তার দৃশ্য গাড়ি ব্যবহার করে পরিমাপ করা হয়েছে। 20150528 থেকে 20190607 পর্যন্ত ক্যালিফোর্নিয়ার তিনটি অঞ্চল - সান ফ্রান্সিসকো বে এলাকা, লস অ্যাঞ্জেলেস এবং উত্তর সান জোয়াকিন উপত্যকার রাস্তাগুলির জন্য 1-হার্টজ সময়ের রেজোলিউশনে ডেটা সংগ্রহ করা হয়েছিল৷ কাঙ্ক্ষিত স্থানিক ডেটা কভারেজ এবং বিজ্ঞানের প্রশ্নগুলির উপর ভিত্তি করে নির্দিষ্ট অঞ্চলগুলি অঞ্চল অনুসারে পরিবর্তিত হয়। প্রতিটি ডেটা পয়েন্ট অক্ষাংশ এবং দ্রাঘিমাংশের পাশাপাশি গাড়ির পরিচয় এবং গতির সাথে জিওলোকেটেড করা হয়।
পদ্ধতি, মান, ডেটা প্রদানকারী, মেটাডেটা ক্ষেত্রের সংজ্ঞা এবং বর্ণনা সহ বিস্তারিত জানার জন্য, মেটাডেটা পড়ুন।
টেবিল স্কিমা
টেবিল স্কিমা
নাম
টাইপ
বর্ণনা
বিসি
দ্বিগুণ
কালো কার্বন ঘনত্ব
CH4
দ্বিগুণ
মিথেন শুষ্ক বায়ু মিশ্রণ অনুপাত
CO2
দ্বিগুণ
কার্বন ডাই অক্সাইড মিশ্রণের অনুপাত
কার_আইডেন্টিফায়ার
STRING
চারটি গাড়ির জন্য স্বতন্ত্র শনাক্তকারী (Car_A/B/C/D)
গাড়ির_গতি
দ্বিগুণ
গাড়ির গতি
তারিখ_সময়
STRING
UTC-এ সময়, YYYY-MM-DD hh:mm:ss ফর্ম্যাট
মেটাডেটা_লিঙ্ক
STRING
নথির লিঙ্ক
না
দ্বিগুণ
নাইট্রোজেন মনোক্সাইড মিশ্রণের অনুপাত
NO2
দ্বিগুণ
নাইট্রোজেন ডাই অক্সাইড মিশ্রণের অনুপাত
NO2_অতিরিক্ত
STRING
বুলিয়ান পতাকা যা পরিমাপ করা মান নির্দেশ করে যন্ত্রের স্পেসিফিকেশনের অপারেটিং পরিসরের চেয়ে বেশি। এই ক্ষেত্র খালি হতে পারে.
NO_অতিরিক্ত
STRING
বুলিয়ান পতাকা যা পরিমাপ করা মান নির্দেশ করে যন্ত্রের স্পেসিফিকেশনের অপারেটিং পরিসরের চেয়ে বেশি। এই ক্ষেত্র খালি হতে পারে.
O3
দ্বিগুণ
ওজোন মিশ্রণ অনুপাত
PN1
দ্বিগুণ
0.3 এবং 0.5 μm মধ্যে কণা সংখ্যা ঘনত্ব
PN2
দ্বিগুণ
0.5 এবং 0.7 μm মধ্যে কণা সংখ্যা ঘনত্ব
PN3
দ্বিগুণ
0.7 এবং 1.0 μm মধ্যে কণা সংখ্যা ঘনত্ব
PN4
দ্বিগুণ
1.0 এবং 1.5 μm এর মধ্যে কণা সংখ্যা ঘনত্ব
PN5
দ্বিগুণ
কণা সংখ্যা ঘনত্ব 1.5 এবং 2.5 μm মধ্যে
PN_অতিরিক্ত
STRING
বুলিয়ান পতাকা যা পরিমাপ করা মান নির্দেশ করে যন্ত্রের স্পেসিফিকেশনের অপারেটিং পরিসরের চেয়ে বেশি। এই ক্ষেত্র খালি হতে পারে.
ইউএফপি
দ্বিগুণ
মোট কণা সংখ্যা ঘনত্ব 3 এনএম এর বেশি
UFP_অতিরিক্ত
STRING
বুলিয়ান পতাকা যা পরিমাপ করা মান নির্দেশ করে যন্ত্রের স্পেসিফিকেশনের অপারেটিং পরিসরের চেয়ে বেশি। এই ক্ষেত্র খালি হতে পারে.
এই বৃহৎ ভেক্টর ডেটাসেটে NO, NO2, O3, CH4, CO2, BC, PN2.5 এবং ক্যালিফোর্নিয়ায় জুন 2019 এর মধ্যে UFP ঘনত্বের উচ্চ রেজোলিউশনের বায়ু দূষণ ম্যাপিং রয়েছে। ডেটাসেটটিতে রয়েছে চারটি Google Street View যানবাহন ব্যবহার করে সংগৃহীত পরিমাপ এবং Acli-এ সজ্জিত মোবাইল ডেটাসেট...
[null,null,[],[[["\u003cp\u003eThis dataset provides high-resolution air pollution data for California, including NO, NO2, O3, CH4, CO2, BC, PN2.5, and UFP concentrations.\u003c/p\u003e\n"],["\u003cp\u003eData was collected from 2015 to 2019 using four Google Street View cars equipped with Aclima's mobile measurement platform.\u003c/p\u003e\n"],["\u003cp\u003eThe dataset covers regions in California including the San Francisco Bay Area, Los Angeles, and the northern San Joaquin Valley.\u003c/p\u003e\n"],["\u003cp\u003eMeasurements were taken at 1-Hz time resolution and include geolocation data (latitude, longitude) along with car speed and identifier.\u003c/p\u003e\n"],["\u003cp\u003eThe dataset is available under a CC-BY-NC-4.0 license and requires attribution to Google and Aclima.\u003c/p\u003e\n"]]],["The dataset provides air pollution data for California from May 2015 to June 2019, gathered by four Google Street View vehicles. These vehicles measured concentrations of NO, NO2, O3, CH4, CO2, BC, PN2.5, and UFP in regions like the San Francisco Bay Area and Los Angeles. Data points are geolocated and include car identity and speed. The table schema, available for use in earth engine, includes the concentration of pollutants and details like date, time, and car identifier.\n"],null,["# Google Street View Air Quality: High Resolution Air Pollution Mapping in California\n\nDataset Availability\n: 2015-05-28T00:00:00Z--2019-06-07T00:00:00Z\n\nDataset Provider\n:\n\n\n [Google / Aclima](https://medium.com/google-earth/powering-new-research-with-hyperlocal-air-pollution-data-c9947359e87e)\n\nTags\n:\n[air-quality](/earth-engine/datasets/tags/air-quality) [atmosphere](/earth-engine/datasets/tags/atmosphere) [nitrogen-dioxide](/earth-engine/datasets/tags/nitrogen-dioxide) [pollution](/earth-engine/datasets/tags/pollution) [table](/earth-engine/datasets/tags/table) \n\n#### Description\n\nThis large vector dataset contains high resolution air pollution mapping of\nNO, NO2, O3, CH4, CO2, BC, PN2.5, and UFP concentrations in California\nbetween June 2015 and June 2019.\n\nThe dataset consists of measurements collected using four Google Street View\nvehicles equipped with the Aclima mobile measurement and data integration\nplatform from 2015-05-28 to 2019-06-07. Not all four cars were actively\nmapping over the entire time frame. Note that there may be gaps in the data\nwhen an individual car was not mapping due to operational, mechanical, or\nsystem difficulties.\n\nDates of operation for each of the four cars:\n\n- Car A: 2016-05-03 - 2019-04-30\n- Car B: 2016-05-03 - 2018-06-08\n- Car C: 2015-05-28 - 2019-06-07\n- Car D: 2015-06-24 - 2018-11-05\n\nData was collected in several geographic regions of California including the\nSan Francisco Bay Area, Los Angeles, and the northern San Joaquin Valley.\nMapping occurred in targeted neighborhoods or cities within these regions.\nThe data set contains a table titled \"California_Unified_2015_2019\" which\nconsists of the concentration of the pollutants Ozone (O3), Nitrogen Dioxide\n(NO2), Nitrogen Monoxide (NO), Methane (CH4), Carbon Dioxide (CO2),\nBlack Carbon (BC), particle number less than 2.5 micrometers in size\n(PN2.5), and Ultrafine Particles (UFP) measured using four Google Street\nView cars equipped with fast time-response, laboratory-grade instruments.\nThe data was collected at 1-Hz time resolution from 20150528 to 20190607 for\nroads in three regions of California - the San Francisco Bay area,\nLos Angeles, and the northern San Joaquin Valley. Specific areas mapped\nvaried by region based on desired spatial data coverage and science\nquestions. Each data point is geolocated with latitude and longitude as\nwell as the identity and speed of the car.\n\nFor details including methodologies, standards, data providers,\nmetadata field definitions and descriptions, refer to the\n[metadata](https://docs.google.com/document/d/1If15JccoJcN01Jg3ljN3V-qUFS0HywKAd4OsQ-_JXJo/view).\n\n### Table Schema\n\n**Table Schema**\n\n| Name | Type | Description |\n|----------------|--------|--------------------------------------------------------------------------------------------------------------------------------------------|\n| BC | DOUBLE | Black carbon concentration |\n| CH4 | DOUBLE | Methane dry air mixing ratio |\n| CO2 | DOUBLE | Carbon dioxide mixing ratio |\n| Car_Identifier | STRING | Unique identifier for the four vehicles (Car_A/B/C/D) |\n| Car_Speed | DOUBLE | Car speed |\n| Date_Time | STRING | Time in UTC, format YYYY-MM-DD hh:mm:ss |\n| Metadata_Link | STRING | Link to the document |\n| NO | DOUBLE | Nitrogen monoxide mixing ratio |\n| NO2 | DOUBLE | Nitrogen dioxide mixing ratio |\n| NO2_Overrange | STRING | Boolean flag indicating the measured value was higher than the operating range of the instrument's specification. This field can be empty. |\n| NO_Overrange | STRING | Boolean flag indicating the measured value was higher than the operating range of the instrument's specification. This field can be empty. |\n| O3 | DOUBLE | Ozone mixing ratio |\n| PN1 | DOUBLE | Particle number concentration between 0.3 and 0.5 μm |\n| PN2 | DOUBLE | Particle number concentration between 0.5 and 0.7 μm |\n| PN3 | DOUBLE | Particle number concentration between 0.7 and 1.0 μm |\n| PN4 | DOUBLE | Particle number concentration between 1.0 and 1.5 μm |\n| PN5 | DOUBLE | Particle number concentration between 1.5 and 2.5 μm |\n| PN_Overrange | STRING | Boolean flag indicating the measured value was higher than the operating range of the instrument's specification. This field can be empty. |\n| UFP | DOUBLE | Total particle number concentration greater than 3 nm |\n| UFP_Overrange | STRING | Boolean flag indicating the measured value was higher than the operating range of the instrument's specification. This field can be empty. |\n\n### Terms of Use\n\n**Terms of Use**\n\n[CC-BY-NC-4.0](https://spdx.org/licenses/CC-BY-NC-4.0.html)\n\n### Citations\n\nCitations:\n\n- with the text \"Air Quality Data from Google and Aclima\"\n\n Citation for publications: Google and Aclima 2019: Project Air View California 2015-2019\n\n### Explore with Earth Engine\n\n| **Important:** Earth Engine is a platform for petabyte-scale scientific analysis and visualization of geospatial datasets, both for public benefit and for business and government users. Earth Engine is free to use for research, education, and nonprofit use. To get started, please [register for Earth Engine access.](https://console.cloud.google.com/earth-engine)\n\n### Code Editor (JavaScript)\n\n```javascript\n
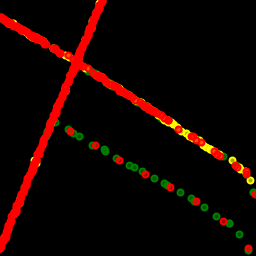
var fc = ee.FeatureCollection('GOOGLE/AirView/California_Unified_2015_2019');\n\nvar normal = fc.filter('NO2 \u003e= 0 && NO2 \u003c 1');\nvar mild = fc.filter('NO2 \u003e= 1 && NO2 \u003c 2');\nvar strong = fc.filter('NO2 \u003e= 2');\n\nMap.addLayer(normal, {color: 'green'}, 'NO2 [0; 1)');\nMap.addLayer(mild, {color: 'yellow'}, 'NO2 [1; 2)');\nMap.addLayer(strong, {color: 'red'}, 'NO2 \u003e= 2');\nMap.setCenter(-122.827746, 38.4001353, 20);\nMap.setOptions('SATELLITE');\n```\n[Open in Code Editor](https://code.earthengine.google.com/?scriptPath=Examples:Datasets/GOOGLE/GOOGLE_AirView_California_Unified_2015_2019) \n[Google Street View Air Quality: High Resolution Air Pollution Mapping in California](/earth-engine/datasets/catalog/GOOGLE_AirView_California_Unified_2015_2019) \nThis large vector dataset contains high resolution air pollution mapping of NO, NO2, O3, CH4, CO2, BC, PN2.5, and UFP concentrations in California between June 2015 and June 2019. The dataset consists of measurements collected using four Google Street View vehicles equipped with the Aclima mobile measurement and data integration ... \nGOOGLE/AirView/California_Unified_2015_2019, air-quality,atmosphere,nitrogen-dioxide,pollution,table \n2015-05-28T00:00:00Z/2019-06-07T00:00:00Z \n-90 -180 90 180 \nGoogle Earth Engine \nhttps://developers.google.com/earth-engine/datasets\n\n- [](https://doi.org/https://medium.com/google-earth/powering-new-research-with-hyperlocal-air-pollution-data-c9947359e87e)\n- [](https://doi.org/https://developers.google.com/earth-engine/datasets/catalog/GOOGLE_AirView_California_Unified_2015_2019)"]]