- 데이터 세트 사용 가능 기간
- 2001-01-01T00:00:00Z–2017-01-01T00:00:00Z
- 데이터 세트 제공업체
- iSDA
- 태그
설명
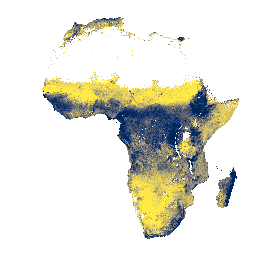
토양 깊이 0~20cm 및 20~50cm에서 2mm 미만 비율의 벌크 밀도, 예측된 평균 및 표준 편차입니다.
픽셀 값은 x/100로 역변환해야 합니다.
밀림이 우거진 지역 (일반적으로 중앙 아프리카)에서는 모델 정확도가 낮으므로 밴딩 (줄무늬)과 같은 아티팩트가 표시될 수 있습니다.
토양 속성 예측은 Innovative Solutions for Decision Agriculture Ltd. (iSDA)에서 머신러닝과 원격 감지 데이터, 분석된 100,000개 이상의 토양 샘플의 학습 세트를 사용하여 30m 픽셀 크기로 이루어졌습니다.
자세한 내용은 FAQ 및 기술 정보 문서를 참고하세요. 문제를 제출하거나 지원을 요청하려면 iSDAsoil 사이트를 방문하세요.
대역
픽셀 크기
30미터
대역
| 이름 | 단위 | 최소 | 최대 | 픽셀 크기 | 설명 |
|---|---|---|---|---|---|
mean_0_20 |
g/cm^3 | 44 | 197 | 미터 | 용적 밀도, 2mm 미만 비율, 0~20cm 깊이에서 예측된 평균 |
mean_20_50 |
g/cm^3 | 44 | 196 | 미터 | 밀도, 2mm 미만 비율, 20~50cm 깊이에서 예측된 평균 |
stdev_0_20 |
g/cm^3 | 0 | 92 | 미터 | 밀도, 2mm 미만 비율, 0~20cm 깊이의 표준 편차 |
stdev_20_50 |
g/cm^3 | 0 | 92 | 미터 | 밀도, 2mm 미만 비율, 20~50cm 깊이에서의 표준 편차 |
이용약관
이용약관
인용
인용:
Hengl, T., Miller, M.A.E., Križan, J., et al. African soil properties and nutrients mapped at 30 m spatial resolution using two-scale ensemble machine learning. Sci Rep 11, 6130 (2021). doi:10.1038/s41598-021-85639-y
Earth Engine으로 탐색하기
코드 편집기(JavaScript)
var mean_0_20 =
'<RasterSymbolizer>' +
 '<ColorMap type="ramp">' +
  '<ColorMapEntry color="#00204D" label="0.8-1.05" opacity="1" quantity="105"/>' +
  '<ColorMapEntry color="#002D6C" label="1.05-1.19" opacity="1" quantity="119"/>' +
  '<ColorMapEntry color="#16396D" label="1.19-1.23" opacity="1" quantity="123"/>' +
  '<ColorMapEntry color="#36476B" label="1.23-1.25" opacity="1" quantity="125"/>' +
  '<ColorMapEntry color="#4B546C" label="1.25-1.28" opacity="1" quantity="128"/>' +
  '<ColorMapEntry color="#5C616E" label="1.28-1.31" opacity="1" quantity="131"/>' +
  '<ColorMapEntry color="#6C6E72" label="1.31-1.34" opacity="1" quantity="134"/>' +
  '<ColorMapEntry color="#7C7B78" label="1.34-1.36" opacity="1" quantity="136"/>' +
  '<ColorMapEntry color="#8E8A79" label="1.36-1.38" opacity="1" quantity="138"/>' +
  '<ColorMapEntry color="#A09877" label="1.38-1.41" opacity="1" quantity="141"/>' +
  '<ColorMapEntry color="#B3A772" label="1.41-1.43" opacity="1" quantity="143"/>' +
  '<ColorMapEntry color="#C6B66B" label="1.43-1.45" opacity="1" quantity="145"/>' +
  '<ColorMapEntry color="#DBC761" label="1.45-1.48" opacity="1" quantity="148"/>' +
  '<ColorMapEntry color="#F0D852" label="1.48-1.51" opacity="1" quantity="151"/>' +
  '<ColorMapEntry color="#FFEA46" label="1.51-1.85" opacity="1" quantity="154"/>' +
 '</ColorMap>' +
 '<ContrastEnhancement/>' +
'</RasterSymbolizer>';

var mean_20_50 =
'<RasterSymbolizer>' +
 '<ColorMap type="ramp">' +
  '<ColorMapEntry color="#00204D" label="0.8-1.05" opacity="1" quantity="105"/>' +
  '<ColorMapEntry color="#002D6C" label="1.05-1.19" opacity="1" quantity="119"/>' +
  '<ColorMapEntry color="#16396D" label="1.19-1.23" opacity="1" quantity="123"/>' +
  '<ColorMapEntry color="#36476B" label="1.23-1.25" opacity="1" quantity="125"/>' +
  '<ColorMapEntry color="#4B546C" label="1.25-1.28" opacity="1" quantity="128"/>' +
  '<ColorMapEntry color="#5C616E" label="1.28-1.31" opacity="1" quantity="131"/>' +
  '<ColorMapEntry color="#6C6E72" label="1.31-1.34" opacity="1" quantity="134"/>' +
  '<ColorMapEntry color="#7C7B78" label="1.34-1.36" opacity="1" quantity="136"/>' +
  '<ColorMapEntry color="#8E8A79" label="1.36-1.38" opacity="1" quantity="138"/>' +
  '<ColorMapEntry color="#A09877" label="1.38-1.41" opacity="1" quantity="141"/>' +
  '<ColorMapEntry color="#B3A772" label="1.41-1.43" opacity="1" quantity="143"/>' +
  '<ColorMapEntry color="#C6B66B" label="1.43-1.45" opacity="1" quantity="145"/>' +
  '<ColorMapEntry color="#DBC761" label="1.45-1.48" opacity="1" quantity="148"/>' +
  '<ColorMapEntry color="#F0D852" label="1.48-1.51" opacity="1" quantity="151"/>' +
  '<ColorMapEntry color="#FFEA46" label="1.51-1.85" opacity="1" quantity="154"/>' +
 '</ColorMap>' +
 '<ContrastEnhancement/>' +
'</RasterSymbolizer>';

var stdev_0_20 =
'<RasterSymbolizer>' +
 '<ColorMap type="ramp">' +
  '<ColorMapEntry color="#fde725" label="low" opacity="1" quantity="2"/>' +
  '<ColorMapEntry color="#5dc962" label=" " opacity="1" quantity="4"/>' +
  '<ColorMapEntry color="#20908d" label=" " opacity="1" quantity="5"/>' +
  '<ColorMapEntry color="#3a528b" label=" " opacity="1" quantity="7"/>' +
  '<ColorMapEntry color="#440154" label="high" opacity="1" quantity="9"/>' +
 '</ColorMap>' +
 '<ContrastEnhancement/>' +
'</RasterSymbolizer>';

var stdev_20_50 =
'<RasterSymbolizer>' +
 '<ColorMap type="ramp">' +
  '<ColorMapEntry color="#fde725" label="low" opacity="1" quantity="2"/>' +
  '<ColorMapEntry color="#5dc962" label=" " opacity="1" quantity="4"/>' +
  '<ColorMapEntry color="#20908d" label=" " opacity="1" quantity="5"/>' +
  '<ColorMapEntry color="#3a528b" label=" " opacity="1" quantity="7"/>' +
  '<ColorMapEntry color="#440154" label="high" opacity="1" quantity="9"/>' +
 '</ColorMap>' +
 '<ContrastEnhancement/>' +
'</RasterSymbolizer>';

var raw = ee.Image("ISDASOIL/Africa/v1/bulk_density");
Map.addLayer(
    raw.select(0).sldStyle(mean_0_20), {},
    "Bulk density, mean visualization, 0-20 cm");
Map.addLayer(
    raw.select(1).sldStyle(mean_20_50), {},
    "Bulk density, mean visualization, 20-50 cm");
Map.addLayer(
    raw.select(2).sldStyle(stdev_0_20), {},
    "Bulk density, stdev visualization, 0-20 cm");
Map.addLayer(
    raw.select(3).sldStyle(stdev_20_50), {},
    "Bulk density, stdev visualization, 20-50 cm");

var converted = raw.divide(100);

var visualization = {min: 1, max: 1.5};

Map.setCenter(25, -3, 2);

Map.addLayer(converted.select(0), visualization, "Bulk density, mean, 0-20 cm");