- Disponibilidade de conjuntos de dados
- 2000-01-01T00:00:00Z–2014-12-27T00:00:00Z
- Provedor de conjunto de dados
- Numerical Terradynamic Simulation Group, The University of Montana
- Cadência
- 8 dias
- Tags
Descrição
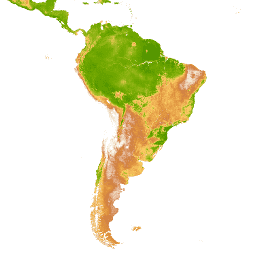
O produto MOD16A2 V105 fornece informações sobre evapotranspiração terrestre global de oito dias com resolução de pixel de 1 km. A evapotranspiração (ET) é a soma da evaporação e da transpiração das plantas da superfície da Terra para a atmosfera. Com dados de ET de longo prazo, é possível quantificar os efeitos das mudanças no clima, no uso da terra e nas perturbações dos ecossistemas.
O produto MOD16A2 é produzido pelo Numerical Terradynamic Simulation Group NTSG, da Universidade de Montana (UMT), em conjunto com o NASA Earth Observing System. Para mais detalhes sobre o algoritmo usado, consulte o documento de base teórica do algoritmo.
- O período de cobertura é de oito dias, exceto o último período no final do ano, que é de cinco ou seis dias. As unidades de ET/PET são 0, 1 mm/5 dias para 27 a 31 de dezembro de 2001, 2002, 2003, 2005, 2006, 2007, 2009, 2010 e 0, 1 mm/6 dias para 26 a 31 de dezembro de 2000, 2004 e 2008 (anos bissextos).
** Para alguns pixels na floresta tropical africana, os dados de albedo do MODIS de MCD43B2/MCD43B3 não têm dados sem nuvens durante um ano inteiro. Como resultado, os pixels desse ano em todas as bandas de dados são mascarados.
Bandas
Tamanho do pixel
1.000 metros
Bandas
| Nome | Unidades | Mín. | Máx. | Escala | Tamanho do pixel | Descrição | |||||||||||||||||||||||||||||||||||||||||||||||||||||||||||||||||||||||||||||||||||||||||||||
|---|---|---|---|---|---|---|---|---|---|---|---|---|---|---|---|---|---|---|---|---|---|---|---|---|---|---|---|---|---|---|---|---|---|---|---|---|---|---|---|---|---|---|---|---|---|---|---|---|---|---|---|---|---|---|---|---|---|---|---|---|---|---|---|---|---|---|---|---|---|---|---|---|---|---|---|---|---|---|---|---|---|---|---|---|---|---|---|---|---|---|---|---|---|---|---|---|---|---|---|
ET |
kg/m^2 | -5* | 453* | 0,1 | metros | Evapotranspiração, agregada para o período de cobertura. |
|||||||||||||||||||||||||||||||||||||||||||||||||||||||||||||||||||||||||||||||||||||||||||||
LE |
J/m²/dia | -20* | 1671* | 10000 | metros | Fluxo de calor latente, com média diária no período de cobertura. |
|||||||||||||||||||||||||||||||||||||||||||||||||||||||||||||||||||||||||||||||||||||||||||||
PET |
kg/m^2 | -8* | 793* | 0,1 | metros | Evapotranspiração potencial, agregada para o período de cobertura. |
|||||||||||||||||||||||||||||||||||||||||||||||||||||||||||||||||||||||||||||||||||||||||||||
PLE |
J/m²/dia | -40* | 3174* | 10000 | metros | Fluxo de calor latente potencial, com média diária durante o período de cobertura. |
|||||||||||||||||||||||||||||||||||||||||||||||||||||||||||||||||||||||||||||||||||||||||||||
ET_QC |
metros | Controle de qualidade de ET. |
|||||||||||||||||||||||||||||||||||||||||||||||||||||||||||||||||||||||||||||||||||||||||||||||||
Propriedades de imagens
Propriedades da imagem
| Nome | Tipo | Descrição |
|---|---|---|
| days_of_coverage | DOUBLE | Número de dias cobertos por cada imagem desde o período de cobertura do último recurso do ano, que pode ter duração variável |
Termos de Uso
Termos de Uso
Todos os dados do NTSG distribuídos por este site não têm restrições de uso, venda ou redistribuição subsequentes.
Citações
Qiaozhen Mu, Maosheng Zhao, Steven W. Running and Numerical Terradynamic Simulation Group (2014): MODIS Global Terrestrial Evapotranspiration (ET) Product MOD16A2 Collection 5.
Explorar com o Earth Engine
Editor de código (JavaScript)
var dataset = ee.ImageCollection('MODIS/NTSG/MOD16A2/105')
                  .filter(ee.Filter.date('2014-04-01', '2014-06-01'));
var evapotranspiration = dataset.select('ET');
var evapotranspirationVis = {
  min: 0,
  max: 300,
  palette:
      ['a50000', 'ff4f1a', 'f1e342', 'c7ef1f', '05fff3', '1707ff', 'd90bff'],
};
Map.setCenter(6.746, 46.529, 2);
Map.addLayer(evapotranspiration, evapotranspirationVis, 'Evapotranspiration');