- 数据集可用时间
- 1842-10-25T00:00:00Z–2024-05-19T00:00:00Z
- 数据集生产者
- NOAA NCEI
- 标签
说明
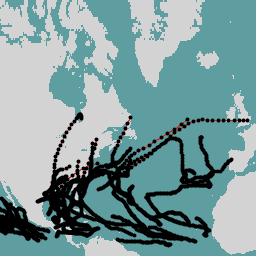
International Best Track Archive for Climate Stewardship (IBTrACS) 提供全球热带气旋的位置和强度。数据范围从 19 世纪 40 年代至今,一般以 3 小时为间隔提供数据。 虽然最佳路径数据侧重于位置和强度(最大持续风速或最低中心气压),但一些机构也提供其他参数(例如,最大风速半径、环境气压、飓风级风半径等),这些参数同样在 IBTrACS 中提供。文件按海盆或时间段提供,其中海盆包括:东太平洋、北大西洋、北印度洋、南大西洋、南印度洋、南太平洋和西太平洋。
表格结构
表格结构
| 名称 | 类型 | 说明 | |||||||||||||||||||||||||||||||||||||||||||||||||||
|---|---|---|---|---|---|---|---|---|---|---|---|---|---|---|---|---|---|---|---|---|---|---|---|---|---|---|---|---|---|---|---|---|---|---|---|---|---|---|---|---|---|---|---|---|---|---|---|---|---|---|---|---|---|
| SID | STRING | 风暴标识符 |
|||||||||||||||||||||||||||||||||||||||||||||||||||
| SEASON | 双精度 | 风暴发生的年份 |
|||||||||||||||||||||||||||||||||||||||||||||||||||
| 数字 | 双精度 | 相应赛季的系统基数。 该计数包括所有流域,因此对于流域文件,该计数不会是连续的。 |
|||||||||||||||||||||||||||||||||||||||||||||||||||
| BASIN | STRING | 盆地包括:
|
|||||||||||||||||||||||||||||||||||||||||||||||||||
| SUBBASIN | STRING | 子流域包括:
|
|||||||||||||||||||||||||||||||||||||||||||||||||||
| NAME | STRING | 代理机构提供的名称 |
|||||||||||||||||||||||||||||||||||||||||||||||||||
| ISO_TIME | STRING | 以世界协调时间 (UTC) 提供的 ISO 时间。 格式为 YYYY-MM-DD HH:mm:ss 大多数点以 6 小时为间隔提供。 部分代理机构提供了 3 小时点(例如,新德里)或重要观测时间(例如,北大西洋的登陆时间等) |
|||||||||||||||||||||||||||||||||||||||||||||||||||
| NATURE | STRING | 合并后的风暴类型。 此值是根据所有可用的风暴类型分配的。 值:
|
|||||||||||||||||||||||||||||||||||||||||||||||||||
| WMO_WIND | 双精度 | 世界气象组织 (WMO) 针对当前位置提供的最大持续风速。 风速平均时段的差异未进行调整。 hurdat/atcf = 北大西洋 - 美国迈阿密(美国国家海洋和大气管理局 [NOAA] NHC)- 1 分钟风速 tokyo = 东京 RSMC(日本气象厅 [JMA])- 10 分钟风速 newdelhi = 新德里 RSMC(印度气象局 [IMD])- 3 分钟风速 reunion = 留尼汪 RSMC(MFLR)- 10 分钟风速 bom = 澳大利亚 TCWC(珀斯、达尔文、布里斯班)- 10 分钟风速 nadi = 纳迪 RSMC(FMS)- 10 分钟风速 wellington = 惠灵顿 TCWC(NZMS)- 10 分钟风速 |
|||||||||||||||||||||||||||||||||||||||||||||||||||
| WMO_PRES | 双精度 | 负责任的 WMO 机构分配的最低中心气压 |
|||||||||||||||||||||||||||||||||||||||||||||||||||
| WMO_AGENCY | STRING | 这是目前列出的负责相应流域的报告机构。请注意,许多机构直到最近才接受 WMO 的官方责任,例如,1993 年的留尼汪或 1990 年的 IMD。因此,WMO 机构被宽泛地用于描述当前负责的机构。 |
|||||||||||||||||||||||||||||||||||||||||||||||||||
| TRACK_TYPE | STRING | 轨道类型 热带风暴可以相互作用。 值:
|
|||||||||||||||||||||||||||||||||||||||||||||||||||
| DIST2LAND | 双精度 | 从当前位置到陆地的距离。 陆地数据集包含所有大陆以及面积大于 1400 平方公里的岛屿。距离是指当前时间在任何方向上的最近距离。 |
|||||||||||||||||||||||||||||||||||||||||||||||||||
| LANDFALL | 双精度 | 未来 6 小时内最适合降落的地点。 这可以视为登陆标志: =0 -- 6 小时内登陆。
|
|||||||||||||||||||||||||||||||||||||||||||||||||||
| IFLAG | STRING | 插补标志 一个 14 字符的标志字符串,用于表示每个机构报告的来源。 值:
14 个字符的顺序是指以下 14 个数据集:
|
|||||||||||||||||||||||||||||||||||||||||||||||||||
| USA_AGENCY | STRING | 提供信息的代理机构文件:美国代理机构代表性数据源自分层选择:以下列表中第一个在给定时间提供信息的数据集将用作 USA_agency。值:
虽然这些机构通常是正交的,但在某些情况下,一个系统可能由多个来源提供。在这种情况下,系统会使用来自最高来源的报告。 ATCF 格式信息来源:https://www.nrlmry.navy.mil/atcf_web/docs/database/new/abdeck.txt HURDAT2 信息来源: http://www.nhc.noaa.gov/data/hurdat/hurdat2-format-atlantic.pdf |
|||||||||||||||||||||||||||||||||||||||||||||||||||
| USA_ATCF_ID | STRING | ATCF ID 由美国机构分配,可用于将风暴与其他美国气旋相关数据集进行比较。
如果两个(或更多)ATCF 轨迹构成一个风暴,则这些 ID 会以英文冒号分隔。
ATCF ID 的格式为 B
对于临时数据,我们提供了其他流域标识符,包括:
|
|||||||||||||||||||||||||||||||||||||||||||||||||||
| USA_LAT | 双精度 | 美国纬度 |
|||||||||||||||||||||||||||||||||||||||||||||||||||
| USA_LON | 双精度 | 美国经度 |
|||||||||||||||||||||||||||||||||||||||||||||||||||
| USA_RECORD | STRING | 记录标识符。 值:
|
|||||||||||||||||||||||||||||||||||||||||||||||||||
| USA_STATUS | STRING | 系统状态。 值:
|
|||||||||||||||||||||||||||||||||||||||||||||||||||
| USA_WIND | 双精度 | 最大持续风速(以节为单位):0 - 300 节 |
|||||||||||||||||||||||||||||||||||||||||||||||||||
| USA_PRES | 双精度 | 最低海平面气压,850 - 1050 mb。 |
|||||||||||||||||||||||||||||||||||||||||||||||||||
| USA_SSHS | STRING | 基于美国机构提供的风速(美国机构提供 1 分钟风速)的萨菲尔-辛普森飓风等级信息 值:
根据风速分类的热带系统 [TD、TS、HU、TY、TC、ST、HR] 值:
|
|||||||||||||||||||||||||||||||||||||||||||||||||||
| USA_R34_NE | 双精度 | 东北象限内 34 节风速半径的最大范围 |
|||||||||||||||||||||||||||||||||||||||||||||||||||
| USA_R34_SE | 双精度 | 东南象限内 34 节风半径的最大范围 |
|||||||||||||||||||||||||||||||||||||||||||||||||||
| USA_R34_SW | 双精度 | 西南象限内 34 节风半径的最大范围 |
|||||||||||||||||||||||||||||||||||||||||||||||||||
| USA_R34_NW | 双精度 | 西北象限内 34 kt 风半径的最大范围 |
|||||||||||||||||||||||||||||||||||||||||||||||||||
| USA_R50_NE | 双精度 | 东北象限内 50 节风速半径的最大范围 |
|||||||||||||||||||||||||||||||||||||||||||||||||||
| USA_R50_SE | 双精度 | 东南象限内 50 节风速半径的最大范围 |
|||||||||||||||||||||||||||||||||||||||||||||||||||
| USA_R50_SW | 双精度 | 西南象限内 50 节风半径的最大范围 |
|||||||||||||||||||||||||||||||||||||||||||||||||||
| USA_R50_NW | 双精度 | 西北象限内 50 节风半径的最大范围 |
|||||||||||||||||||||||||||||||||||||||||||||||||||
| USA_R64_NE | 双精度 | 东北象限内 64 节风速半径的最大范围 |
|||||||||||||||||||||||||||||||||||||||||||||||||||
| USA_R64_SE | 双精度 | 东南象限内 64 节风速半径的最大范围 |
|||||||||||||||||||||||||||||||||||||||||||||||||||
| USA_R64_SW | 双精度 | 西南象限内 64 kt 风半径的最大范围 |
|||||||||||||||||||||||||||||||||||||||||||||||||||
| USA_R64_NW | 双精度 | 西北象限内 64 海里风圈的最大范围 |
|||||||||||||||||||||||||||||||||||||||||||||||||||
| USA_POCI | 双精度 | 最后一条闭合等压线的压力(以毫巴为单位),900 - 1050 毫巴 非最佳追踪(未重新分析) |
|||||||||||||||||||||||||||||||||||||||||||||||||||
| USA_ROCI | 双精度 | 最后一个闭合等压线的半径,0 - 999 海里。 未进行最佳追踪(未重新分析) |
|||||||||||||||||||||||||||||||||||||||||||||||||||
| USA_RMW | 双精度 | 最大风速半径,0 - 999 海里。 未进行最佳追踪(未重新分析) |
|||||||||||||||||||||||||||||||||||||||||||||||||||
| USA_EYE | 双精度 | 眼直径,0 - 120 海里。 未进行最佳追踪(未重新分析) |
|||||||||||||||||||||||||||||||||||||||||||||||||||
| TOKYO_LAT | 双精度 | 东京纬度 |
|||||||||||||||||||||||||||||||||||||||||||||||||||
| TOKYO_LON | 双精度 | 东京经度 |
|||||||||||||||||||||||||||||||||||||||||||||||||||
| TOKYO_GRADE | STRING | 成绩值:
|
|||||||||||||||||||||||||||||||||||||||||||||||||||
| TOKYO_WIND | 双精度 | 最大持续风速 [10 分钟平均周期] |
|||||||||||||||||||||||||||||||||||||||||||||||||||
| TOKYO_PRES | 双精度 | 中心压力 |
|||||||||||||||||||||||||||||||||||||||||||||||||||
| TOKYO_R50_DIR | STRING |
|
|||||||||||||||||||||||||||||||||||||||||||||||||||
| TOKYO_R50_LONG | 双精度 | 风速达到 50 节或更高的最长半径 |
|||||||||||||||||||||||||||||||||||||||||||||||||||
| TOKYO_R50_SHORT | 双精度 | 风速不低于 50 节的最短半径 |
|||||||||||||||||||||||||||||||||||||||||||||||||||
| TOKYO_R30_DIR | STRING |
|
|||||||||||||||||||||||||||||||||||||||||||||||||||
| TOKYO_R30_LONG | 双精度 | 30 节或更高风速的最长半径 |
|||||||||||||||||||||||||||||||||||||||||||||||||||
| TOKYO_R30_SHORT | 双精度 | 30 海里风速或更强风速的最短半径 |
|||||||||||||||||||||||||||||||||||||||||||||||||||
| TOKYO_LAND | STRING | 登陆或经过日本岛屿的时间是在此指标的分析时间后一小时内。 |
|||||||||||||||||||||||||||||||||||||||||||||||||||
| CMA_LAT | 双精度 | CMA Latitude |
|||||||||||||||||||||||||||||||||||||||||||||||||||
| CMA_LON | 双精度 | CMA 经度 |
|||||||||||||||||||||||||||||||||||||||||||||||||||
| CMA_CAT | STRING | 根据中国国家标准《热带气旋等级》(自 2006 年 6 月 15 日起使用)确定的强度类别。值:
|
|||||||||||||||||||||||||||||||||||||||||||||||||||
| CMA_WIND | 双精度 | 热带气旋中心附近的两分钟平均最大持续风速(MSW;米/秒)。 WND = 9 表示 MSW < 10 m/s,WND = 0 表示强度未知。 |
|||||||||||||||||||||||||||||||||||||||||||||||||||
| HKO_LAT | 双精度 | 香港天文台纬度 |
|||||||||||||||||||||||||||||||||||||||||||||||||||
| HKO_LON | 双精度 | 美国经度 |
|||||||||||||||||||||||||||||||||||||||||||||||||||
| HKO_CAT | 双精度 | 2009 年之后,我们又在台风之上细分了两种风暴类型,因此总共有 7 种风暴类型 LW(低气压)<22 海里 TD(热带低气压)22 - 33 海里 TS(热带风暴)34 - 47 海里 STS(强热带风暴)48 - 63 海里 T(台风)64 - 80 海里 ST(强台风)81 - 99 海里 SuperT(超强台风)>= 100 海里 |
|||||||||||||||||||||||||||||||||||||||||||||||||||
| HKO_WIND | 双精度 | 最大持续风速 |
|||||||||||||||||||||||||||||||||||||||||||||||||||
| HKO_PRES | 双精度 | 最低海平面气压 |
|||||||||||||||||||||||||||||||||||||||||||||||||||
| NEWDELHI_LAT | 双精度 | 新德里纬度 |
|||||||||||||||||||||||||||||||||||||||||||||||||||
| NEWDELHI_LON | 双精度 | 新德里经度 |
|||||||||||||||||||||||||||||||||||||||||||||||||||
| NEWDELHI_GRADE | STRING | 干扰类型:
|
|||||||||||||||||||||||||||||||||||||||||||||||||||
| NEWDELHI_WIND | 双精度 | 最大持续风速 |
|||||||||||||||||||||||||||||||||||||||||||||||||||
| NEWDELHI_PRES | 双精度 | 最低海平面气压 |
|||||||||||||||||||||||||||||||||||||||||||||||||||
| NEWDELHI_CI | STRING | Dvorak CI-number |
|||||||||||||||||||||||||||||||||||||||||||||||||||
| NEWDELHI_DP | 双精度 | 新德里 DP |
|||||||||||||||||||||||||||||||||||||||||||||||||||
| NEWDELHI_POCI | 双精度 | 气旋所处环境的压力 |
|||||||||||||||||||||||||||||||||||||||||||||||||||
| REUNION_LAT | 双精度 | 留尼旺纬度 |
|||||||||||||||||||||||||||||||||||||||||||||||||||
| REUNION_LON | 双精度 | 留尼汪经度 |
|||||||||||||||||||||||||||||||||||||||||||||||||||
| REUNION_TYPE | STRING |
|
|||||||||||||||||||||||||||||||||||||||||||||||||||
| REUNION_WIND | 双精度 | 最大平均风速 |
|||||||||||||||||||||||||||||||||||||||||||||||||||
| REUNION_PRES | 双精度 | 中心压力 |
|||||||||||||||||||||||||||||||||||||||||||||||||||
| REUNION_TNUM | STRING | Dvorak T-number |
|||||||||||||||||||||||||||||||||||||||||||||||||||
| REUINION_CI | STRING | Dvorak CI-number |
|||||||||||||||||||||||||||||||||||||||||||||||||||
| REUNION_RMW | 双精度 | 最大风速半径 |
|||||||||||||||||||||||||||||||||||||||||||||||||||
| REUNION_R34_NE | 双精度 | 东北象限内 34 节风速半径的最大范围 |
|||||||||||||||||||||||||||||||||||||||||||||||||||
| REUNION_R34_SE | 双精度 | 东南象限内 34 节风半径的最大范围 |
|||||||||||||||||||||||||||||||||||||||||||||||||||
| REUNION_R34_SW | 双精度 | 西南象限内 34 节风半径的最大范围 |
|||||||||||||||||||||||||||||||||||||||||||||||||||
| REUNION_R34_NW | 双精度 | 西北象限内 34 kt 风半径的最大范围 |
|||||||||||||||||||||||||||||||||||||||||||||||||||
| REUNION_R50_NE | 双精度 | 东北象限内 50 节风速半径的最大范围 |
|||||||||||||||||||||||||||||||||||||||||||||||||||
| REUNION_R50_SE | 双精度 | 东南象限内 50 节风速半径的最大范围 |
|||||||||||||||||||||||||||||||||||||||||||||||||||
| REUNION_R50_SW | 双精度 | 西南象限内 50 节风半径的最大范围 |
|||||||||||||||||||||||||||||||||||||||||||||||||||
| REUNION_R50_NW | 双精度 | 西北象限内 50 节风半径的最大范围 |
|||||||||||||||||||||||||||||||||||||||||||||||||||
| REUNION_R64_NE | 双精度 | 东北象限内 64 节风速半径的最大范围 |
|||||||||||||||||||||||||||||||||||||||||||||||||||
| REUNION_R64_SE | 双精度 | 东南象限内 64 节风速半径的最大范围 |
|||||||||||||||||||||||||||||||||||||||||||||||||||
| REUNION_R64_SW | 双精度 | 西南象限内 64 kt 风半径的最大范围 |
|||||||||||||||||||||||||||||||||||||||||||||||||||
| REUNION_R64_NW | 双精度 | 西北象限内 64 海里风圈的最大范围 |
|||||||||||||||||||||||||||||||||||||||||||||||||||
| BOM_LAT | 双精度 | BOM 纬度 |
|||||||||||||||||||||||||||||||||||||||||||||||||||
| BOM_LON | 双精度 | BOM 经度 |
|||||||||||||||||||||||||||||||||||||||||||||||||||
| BOM_TYPE | STRING | 这表示旋风在观测时的系统类型。请注意,气旋在其生命周期内可能会演变,因此可能会在中途改变类型(例如,温带气旋转变 [ETT])
|
|||||||||||||||||||||||||||||||||||||||||||||||||||
| BOM_WIND | 双精度 | 这是气旋周围(即中心附近)的估计最大平均风速 |
|||||||||||||||||||||||||||||||||||||||||||||||||||
| BOM_PRES | 双精度 | 气旋的中心气压 |
|||||||||||||||||||||||||||||||||||||||||||||||||||
| BOM_TNUM | STRING | Dvorak T-number |
|||||||||||||||||||||||||||||||||||||||||||||||||||
| BOM_CI | STRING | Dvorak CI-number |
|||||||||||||||||||||||||||||||||||||||||||||||||||
| BOM_RMW | 双精度 | 这是最大平均风速的平均半径(从系统中心开始测量) |
|||||||||||||||||||||||||||||||||||||||||||||||||||
| BOM_R34_NE | 双精度 | 这是大风(17 米/秒)或更强风的平均半径(从系统中心开始)。四个扇形分别显示以基点为中心的相应象限中的平均范围。 东北象限 |
|||||||||||||||||||||||||||||||||||||||||||||||||||
| BOM_R34_SE | 双精度 | 这是大风(17 米/秒)或更强风的平均半径(从系统中心开始)。四个扇形分别显示以基点为中心的相应象限中的平均范围。 东南象限 |
|||||||||||||||||||||||||||||||||||||||||||||||||||
| BOM_R34_SW | 双精度 | 这是大风(17 米/秒)或更强风的平均半径(从系统中心开始)。四个扇形分别显示以基点为中心的相应象限中的平均范围。 西南象限 |
|||||||||||||||||||||||||||||||||||||||||||||||||||
| BOM_R34_NW | 双精度 | 这是大风(17 米/秒)或更强风的平均半径(从系统中心开始)。四个扇形分别显示以基点为中心的相应象限中的平均范围。 西北象限 |
|||||||||||||||||||||||||||||||||||||||||||||||||||
| BOM_R50_NE | 双精度 | 这是大风(25 米/秒)或更强风的平均半径(从系统中心开始)。四个扇形分别显示以基点为中心的相应象限中的平均范围。 东北象限 |
|||||||||||||||||||||||||||||||||||||||||||||||||||
| BOM_R50_SE | 双精度 | 这是大风(25 米/秒)或更强风的平均半径(从系统中心开始)。四个扇形分别显示以基点为中心的相应象限中的平均范围。 东南象限 |
|||||||||||||||||||||||||||||||||||||||||||||||||||
| BOM_R50_SW | 双精度 | 这是大风(25 米/秒)或更强风的平均半径(从系统中心开始)。四个扇形分别显示以基点为中心的相应象限中的平均范围。 西南象限 |
|||||||||||||||||||||||||||||||||||||||||||||||||||
| BOM_R50_NW | 双精度 | 这是大风(25 米/秒)或更强风的平均半径(从系统中心开始)。四个扇形分别显示以基点为中心的相应象限中的平均范围。 西北象限 |
|||||||||||||||||||||||||||||||||||||||||||||||||||
| BOM_R64_NE | 双精度 | 这是大风(33 米/秒)或更强风的平均半径(从系统中心开始)。四个扇形分别显示以基点为中心的相应象限中的平均范围。 东北象限 |
|||||||||||||||||||||||||||||||||||||||||||||||||||
| BOM_R64_SE | 双精度 | 这是大风(33 米/秒)或更强风的平均半径(从系统中心开始)。四个扇形分别显示以基点为中心的相应象限中的平均范围。 东南象限 |
|||||||||||||||||||||||||||||||||||||||||||||||||||
| BOM_R64_SW | 双精度 | 这是大风(33 米/秒)或更强风的平均半径(从系统中心开始)。四个扇形分别显示以基点为中心的相应象限中的平均范围。 西南象限 |
|||||||||||||||||||||||||||||||||||||||||||||||||||
| BOM_R64_NW | 双精度 | 这是大风(33 米/秒)或更强风的平均半径(从系统中心开始)。四个扇形分别显示以基点为中心的相应象限中的平均范围。 西北象限 |
|||||||||||||||||||||||||||||||||||||||||||||||||||
| BOM_ROCI | 双精度 | 最外侧闭合等压线(间隔为 1 hPa)的估计平均半径。 |
|||||||||||||||||||||||||||||||||||||||||||||||||||
| BOM_POCI | 双精度 | 气旋所处环境的压力 |
|||||||||||||||||||||||||||||||||||||||||||||||||||
| BOM_EYE | 双精度 | 旋风眼的平均半径。 |
|||||||||||||||||||||||||||||||||||||||||||||||||||
| BOM_POS_METHOD | STRING | 这表示用于推导系统中心位置的工具。 值:
|
|||||||||||||||||||||||||||||||||||||||||||||||||||
| BOM_PRES_METHOD | STRING | 此代码可能需要在未来进行扩展,以处理新系统,并区分用于推导中心气压的气压与风速关系。
|
|||||||||||||||||||||||||||||||||||||||||||||||||||
| NADI_LAT | 双精度 | 来自斐济纳迪 RSMC 的旋风纬度 |
|||||||||||||||||||||||||||||||||||||||||||||||||||
| NADI_LON | 双精度 | 来自斐济纳迪 RSMC 的旋风经度 |
|||||||||||||||||||||||||||||||||||||||||||||||||||
| NADI_CAT | STRING | Nadi 分配的类别 |
|||||||||||||||||||||||||||||||||||||||||||||||||||
| WELLINGTON_LAT | 双精度 | 惠灵顿 TCWC 的旋风纬度 |
|||||||||||||||||||||||||||||||||||||||||||||||||||
| WELLINGTON_LON | 双精度 | 惠灵顿 TCWC 的旋风经度 |
|||||||||||||||||||||||||||||||||||||||||||||||||||
| WELLINGTON_WIND | 双精度 | 惠灵顿分配的风速 |
|||||||||||||||||||||||||||||||||||||||||||||||||||
| WELLINGTON_PRES | 双精度 | 惠灵顿分配的中心压力 |
|||||||||||||||||||||||||||||||||||||||||||||||||||
| DS824_LAT | 双精度 | 数据集 824 中的气旋纬度 |
|||||||||||||||||||||||||||||||||||||||||||||||||||
| DS824_LON | 双精度 | 数据集 824 中的气旋经度 |
|||||||||||||||||||||||||||||||||||||||||||||||||||
| DS824_STAGE | STRING | TC - 热带气旋 |
|||||||||||||||||||||||||||||||||||||||||||||||||||
| DS824_WIND | 双精度 | 最大风速 |
|||||||||||||||||||||||||||||||||||||||||||||||||||
| DS824_PRES | 双精度 | 中心压力 |
|||||||||||||||||||||||||||||||||||||||||||||||||||
| TD9636_LAT | 双精度 | 来自 NCEI 数据集 TD9636 的旋风纬度 |
|||||||||||||||||||||||||||||||||||||||||||||||||||
| TD9636_LON | 双精度 | 来自 NCEI 数据集 TD9636 的旋风经度 |
|||||||||||||||||||||||||||||||||||||||||||||||||||
| TD9636_STAGE | STRING | 此字段提供指定时间和地点风暴中的最高风速估计值。对于一些较早年份,整个风暴都按达到的最高阶段进行了编码。 值:
|
|||||||||||||||||||||||||||||||||||||||||||||||||||
| TD9636_WIND | 双精度 | 指示时间点的最高估计风速。这些估计值是主观的,必须谨慎解读。 |
|||||||||||||||||||||||||||||||||||||||||||||||||||
| TD9636_PRES | 双精度 | 最低海平面气压 |
|||||||||||||||||||||||||||||||||||||||||||||||||||
| TD9635_ROCI | 双精度 | 大小。(系统半径) |
|||||||||||||||||||||||||||||||||||||||||||||||||||
| NEUMANN_LAT | 双精度 | 气旋纬度(以摄氏度为单位)。Neumann 南半球数据集 |
|||||||||||||||||||||||||||||||||||||||||||||||||||
| NEUMANN_LON | 双精度 | 气旋经度(以 C 为准)。Neumann 南半球数据集 |
|||||||||||||||||||||||||||||||||||||||||||||||||||
| NEUMANN_CLASS | STRING |
|
|||||||||||||||||||||||||||||||||||||||||||||||||||
| NEUMANN_WIND | 双精度 | 最大风速 |
|||||||||||||||||||||||||||||||||||||||||||||||||||
| NEUMANN_PRES | 双精度 | 中心压力 |
|||||||||||||||||||||||||||||||||||||||||||||||||||
| MLC_LAT | 双精度 | M. Chenoweth 数据集 |
|||||||||||||||||||||||||||||||||||||||||||||||||||
| MLC_LON | 双精度 | M. 的气旋经度Chenoweth 数据集 |
|||||||||||||||||||||||||||||||||||||||||||||||||||
| MLC_CLASS | STRING | 风暴分类 值:
|
|||||||||||||||||||||||||||||||||||||||||||||||||||
| MLC_WIND | 双精度 | 最大风速 |
|||||||||||||||||||||||||||||||||||||||||||||||||||
| MLC_PRES | 双精度 | 中心压力 |
|||||||||||||||||||||||||||||||||||||||||||||||||||
| USA_GUST | 双精度 | 美国气象机构报告的阵风。 |
|||||||||||||||||||||||||||||||||||||||||||||||||||
| BOM_GUST | 双精度 | 这是气旋周围的最大阵风估计值,即根据开阔地形估计的中心附近的最大阵风 |
|||||||||||||||||||||||||||||||||||||||||||||||||||
| BOM_GUST_PER | 双精度 | 这是测量最大阵风时使用的阵风时段。 此形参仅在接收到非基于 3 秒阵风的 WMO 格式数据时使用。所有澳大利亚境内的数据都应基于 3 秒阵风。 |
|||||||||||||||||||||||||||||||||||||||||||||||||||
| REUNION_GUST | 双精度 | 最大阵风 |
|||||||||||||||||||||||||||||||||||||||||||||||||||
| REUNION_GUST_PER | 双精度 | 阵风时段 |
|||||||||||||||||||||||||||||||||||||||||||||||||||
| USA_SEAHGT | 双精度 | SEARAD 中定义的半径对应的波高 |
|||||||||||||||||||||||||||||||||||||||||||||||||||
| USA_SEARAD_NE | 双精度 | 从风暴中心向东北方向延伸的海洋径向范围(如 SEAHGT 中所定义)。 |
|||||||||||||||||||||||||||||||||||||||||||||||||||
| USA_SEARAD_SE | 双精度 | 从风暴中心向东南方向延伸的海洋径向范围(如 SEAHGT 中所定义)。 |
|||||||||||||||||||||||||||||||||||||||||||||||||||
| USA_SEARAD_SW | 双精度 | 从风暴中心向西南方向延伸的海洋径向范围(如 SEAHGT 中所定义)。 |
|||||||||||||||||||||||||||||||||||||||||||||||||||
| USA_SEARAD_NW | 双精度 | 从风暴中心向西北方向延伸的海洋径向范围(如 SEAHGT 中所定义)。 |
|||||||||||||||||||||||||||||||||||||||||||||||||||
| STORM_SPEED | 双精度 | 根据 LAT 和 LON 中的位置计算出的系统平移速度 |
|||||||||||||||||||||||||||||||||||||||||||||||||||
| STORM_DIR | 双精度 | 根据 LAT 和 LON 中的位置计算出的系统平移方向。方向是朝向以正北为基准的顺时针角度所指的向量移动 [范围 = 0-360 度] |
使用条款
使用条款
NOAA 的数据、信息和产品,无论通过何种方式提供,均不受版权保护,且公众后续使用不受限制。一旦获取,即可用于任何合法用途。
通过 Earth Engine 探索
代码编辑器 (JavaScript)
var dataset = ee.FeatureCollection('NOAA/IBTrACS/v4');

var waterLand = ee.Image('NOAA/NGDC/ETOPO1').select('bedrock').gt(0.0);
var waterLandBackground =
    waterLand.visualize({palette: ['cadetblue', 'lightgray']});
Map.addLayer(waterLandBackground);

var points = dataset.filter(ee.Filter.eq('SEASON', 2020));

// Find all of the hurricane ids.
var GetId = function(point) {
  return ee.Feature(point).get('SID');
};
var storm_ids = points.toList(5000).map(GetId).distinct();

// Create a line for each hurricane.
var lines = ee.FeatureCollection(storm_ids.map(function(storm_id){
  var pts = points.filter(ee.Filter.eq('SID', ee.String(storm_id)));
  pts = pts.sort('ISO_TIME');
  var line = ee.Geometry.LineString(pts.geometry().coordinates());
  var feature = ee.Feature(line);
  return feature.set('SID', storm_id);
}));

Map.addLayer(lines, {color: 'red'}, 'tracks');

Map.addLayer(points, {color: 'black'}, 'points');

Map.setCenter(-53, 36, 5);
以 FeatureView 形式直观呈现
FeatureView 是 FeatureCollection 的只读加速表示形式。如需了解详情,请访问
FeatureView 文档。
代码编辑器 (JavaScript)
var fvLayer = ui.Map.FeatureViewLayer('NOAA/IBTrACS/v4_FeatureView');

var visParams = {
  isVisible: false,
  pointSize: 20,
  rules: [
    {
      filter: ee.Filter.eq('SEASON', 2020),
      isVisible: true,
      pointFillColor: {
        property: 'STORM_SPEED',
        mode: 'linear',
        palette: ['f1eef6', 'd7b5d8', 'df65b0', 'ce1256'],
        min: 0,
        max: 100
      }
    }
  ]
};

fvLayer.setVisParams(visParams);
fvLayer.setName('2020 storm speed');

Map.setLocked(false, 4);
Map.setCenter(-62.25, 32.19, 4);
Map.add(fvLayer);