- ডেটাসেটের উপলভ্যতা
- 1895-01-01T00:00:00Z–2020-12-01T00:00:00Z
- ডেটাসেট প্রদানকারী
- প্রিজম / ওরেগনস্টেট
- ক্যাডেন্স
- ১ মাস
- ট্যাগ
- জলবায়ু
বিবরণ
PRISM দৈনিক এবং মাসিক ডেটাসেটগুলি হল মার্কিন যুক্তরাষ্ট্রের জন্য গ্রিডেড জলবায়ু ডেটাসেট, যা ওরেগন স্টেট ইউনিভার্সিটির PRISM জলবায়ু গ্রুপ দ্বারা তৈরি করা হয়েছে।
গ্রিডগুলি PRISM (প্যারামিটার-এলিভেশন রিগ্রেশনস অন ইন্ডিপেন্ডেন্ট স্লোপস মডেল) ব্যবহার করে তৈরি করা হয়। PRISM ইন্টারপোলেশন রুটিনগুলি উচ্চতার সাথে আবহাওয়া এবং জলবায়ু কীভাবে পরিবর্তিত হয় তা অনুকরণ করে এবং উপকূলীয় প্রভাব, তাপমাত্রার বিপরীতমুখী পরিবর্তন এবং বৃষ্টির ছায়া সৃষ্টি করতে পারে এমন ভূখণ্ডের বাধাগুলির জন্য দায়ী। স্টেশন ডেটা সারা দেশের অনেক নেটওয়ার্ক থেকে একত্রিত করা হয়। আরও তথ্যের জন্য, PRISM স্থানিক জলবায়ু ডেটাসেটের বর্ণনা দেখুন।
দ্রষ্টব্য
- সতর্কতা : স্টেশন সরঞ্জাম এবং অবস্থানের পরিবর্তন, খোলা এবং বন্ধ, পর্যবেক্ষণের সময় পরিবর্তিত হওয়া এবং অপেক্ষাকৃত স্বল্পমেয়াদী নেটওয়ার্ক ব্যবহারের কারণে শতাব্দীব্যাপী জলবায়ু প্রবণতা গণনা করার জন্য এই ডেটাসেটটি ব্যবহার করা উচিত নয়। আরও বিস্তারিত জানার জন্য দয়া করে ডেটাসেট ডকুমেন্টেশন দেখুন।
- সম্পদের শুরুর সময় দুপুর UTC থেকে, মধ্যরাত UTC থেকে নয়।
- পর্যবেক্ষণ নেটওয়ার্কগুলির মান নিয়ন্ত্রণ এবং স্টেশন ডেটা প্রকাশ করতে সময় লাগে। অতএব, PRISM ডেটাসেটগুলিকে ছয় মাস অতিবাহিত না হওয়া পর্যন্ত বেশ কয়েকবার পুনর্নির্মাণ করা হয়, যখন সেগুলিকে স্থায়ী হিসাবে বিবেচনা করা হয়। একটি প্রকাশের সময়সূচী উপলব্ধ ।
ব্যান্ড
পিক্সেল আকার
৪৬৩৮.৩ মিটার
ব্যান্ড
| নাম | ইউনিট | ন্যূনতম | সর্বোচ্চ | পিক্সেল আকার | বিবরণ |
|---|---|---|---|---|---|
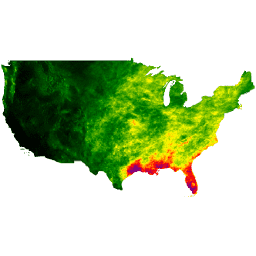
ppt | মিমি | ০* | ২৬৩৯.৮২* | মিটার | মাসিক মোট বৃষ্টিপাত (বৃষ্টি এবং গলিত তুষার সহ) |
tmean | °সে. | -৩০.৮* | ৪১.৪৯* | মিটার | দৈনিক গড় তাপমাত্রার মাসিক গড় (হিসাব করা হয়েছে (tmin+tmax)/2) |
tmin | °সে. | -৩৫.১১* | ৩৪.৭২* | মিটার | মাসিক সর্বনিম্ন তাপমাত্রা |
tmax | °সে. | -২৯.৮* | ৪৯.৭৪* | মিটার | দৈনিক সর্বোচ্চ তাপমাত্রার মাসিক গড় |
tdmean | °সে. | -৩০.৭* | ২৬.৭৬* | মিটার | দৈনিক গড় শিশির বিন্দু তাপমাত্রার মাসিক গড় |
vpdmin | এইচপিএ | ০* | ৪৪.৭৯* | মিটার | দৈনিক সর্বনিম্ন বাষ্প চাপ ঘাটতির মাসিক গড় |
vpdmax | এইচপিএ | ০.০০৯* | ১১০.০৬* | মিটার | দৈনিক সর্বোচ্চ বাষ্পচাপের ঘাটতির মাসিক গড় |
ছবির বৈশিষ্ট্য
ছবির বৈশিষ্ট্য
| নাম | আদর্শ | বিবরণ |
|---|---|---|
| প্রিজম_কোড_ভার্সন | STRING_তালিকা | প্রতি ব্যান্ডের কোড সংস্করণের তালিকা, যেমন: প্রথম উপাদানটি প্রথম ব্যান্ড "ppt" এর জন্য, দ্বিতীয় উপাদানটি দ্বিতীয় ব্যান্ড "tmean" এর জন্য। |
| PRISM_DATASET_CREATE_DATE | STRING_তালিকা | YYYYMMDD ফর্ম্যাটে প্রতি ব্যান্ডের মূল সৃষ্টি তারিখের তালিকা |
| PRISM_DATASET_FILENAME | STRING_তালিকা | প্রতিটি ব্যান্ডের জন্য মূল ফাইলের নামের তালিকা |
| প্রিজম_ডেটাসেট_টাইপ | STRING_তালিকা | প্রতি ব্যান্ডে ডেটাসেটের প্রকারের তালিকা |
| প্রিজম_ডেটাসেট_ভার্সন | STRING_তালিকা | প্রতি ব্যান্ডে ডেটাসেট সংস্করণের তালিকা যেমন: দৈনিক পণ্যের জন্য D1 বা D2; মাসিক পণ্যের জন্য M1, M2 বা M3। |
ব্যবহারের শর্তাবলী
ব্যবহারের শর্তাবলী
এই PRISM ডেটাসেটগুলি ব্যবহার বা বিতরণের কোনও সীমাবদ্ধতা ছাড়াই উপলব্ধ। PRISM ক্লাইমেট গ্রুপ ব্যবহারকারীকে যথাযথ বৈশিষ্ট্য প্রদান এবং প্রযোজ্য ক্ষেত্রে PRISM-কে ডেটার উৎস হিসেবে চিহ্নিত করার অনুরোধ করে।
উদ্ধৃতি
[ড্যালি, সি., জেআই স্মিথ, এবং কেভি ওলসন। ২০১৫। সমসাময়িক মার্কিন যুক্তরাষ্ট্র জুড়ে বায়ুমণ্ডলীয় আর্দ্রতা জলবায়ু ম্যাপিং। PloS ONE 10(10):e0141140. doi:10.1371/journal.pone.0141140 ।
ডিওআই
আর্থ ইঞ্জিনের সাহায্যে ঘুরে দেখুন
কোড এডিটর (জাভাস্ক্রিপ্ট)
var dataset = ee.ImageCollection('OREGONSTATE/PRISM/AN81m')
                  .filter(ee.Filter.date('2018-07-01', '2018-07-31'));
var precipitation = dataset.select('ppt');
var precipitationVis = {
  min: 0.0,
  max: 300.0,
  palette: ['red', 'yellow', 'green', 'cyan', 'purple'],
};
Map.setCenter(-100.55, 40.71, 4);
Map.addLayer(precipitation, precipitationVis, 'Precipitation');