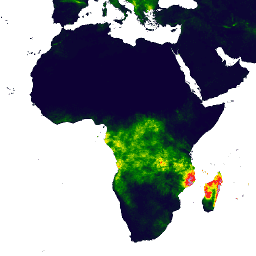
O CHIRPS (Climate Hazards Center InfraRed Precipitation with Station data) é um conjunto de dados de precipitação quase global com mais de 30 anos. O CHIRPS incorpora imagens de satélite de resolução de 0,05° com dados de estações in situ para criar séries temporais de precipitação em grade para análise de tendências e monitoramento de seca sazonal.
Bandas
Tamanho do pixel 5566 metros
Bandas
Nome
Unidades
Mín.
Máx.
Tamanho do pixel
Descrição
precipitation
mm/d
0*
1444,34*
metros
Precipitação
* valor mínimo ou máximo estimado
Termos de Uso
Termos de Uso
Esses conjuntos de dados estão em domínio público. Até onde for possível por lei, Pete Peterson renunciou a todos os direitos autorais e direitos relacionados ou vizinhos à Precipitação Infravermelha do Centro de Riscos Climáticos com Estações (CHIRPS, na sigla em inglês).
Citações
Citações:
Funk, Chris, Pete Peterson, Martin Landsfeld, Diego Pedreros, James
Verdin, Shraddhanand Shukla, Gregory Husak, James Rowland, Laura Harrison,
Andrew Hoell & Joel Michaelsen. "The climate hazards infrared precipitation
with stations-a new environmental record for monitoring extremes".
Scientific Data 2, 150066. doi:10.1038/sdata.2015.66
2015.
O CHIRPS (Infrared Precipitation with Station data do Climate Hazards Center) é um conjunto de dados de precipitação quase global com mais de 30 anos. O CHIRPS incorpora imagens de satélite com resolução de 0,05° e dados de estações in situ para criar séries temporais de precipitação em grade para análise de tendências e monitoramento de seca sazonal.
[null,null,[],[[["\u003cp\u003eCHIRPS is a 30+ year quasi-global rainfall dataset spanning from 1981 to 2024.\u003c/p\u003e\n"],["\u003cp\u003eIt combines 0.05° resolution satellite imagery and in-situ station data for improved accuracy.\u003c/p\u003e\n"],["\u003cp\u003eThe dataset is intended for trend analysis, seasonal drought monitoring, and other climate-related applications.\u003c/p\u003e\n"],["\u003cp\u003eCHIRPS data is publicly available and can be accessed through the Google Earth Engine platform.\u003c/p\u003e\n"],["\u003cp\u003eThe dataset provides daily precipitation data in millimeters per day (mm/d).\u003c/p\u003e\n"]]],["The core content details the CHIRPS rainfall dataset, available from 1981-01-01 to 2025-01-31, provided by UCSB/CHG. This quasi-global dataset merges satellite imagery and station data at a 0.05° resolution, creating daily precipitation grids. It's used for trend analysis and drought monitoring, and it offers data in mm/d units with a pixel size of 5566 meters. The dataset can be accessed and analyzed via Earth Engine, with public-domain usage terms.\n"],null,["# CHIRPS Daily: Climate Hazards Center InfraRed Precipitation With Station Data (Version 2.0 Final)\n\nDataset Availability\n: 1981-01-01T00:00:00Z--2025-07-31T00:00:00Z\n\nDataset Provider\n:\n\n\n [UCSB/CHG](https://chc.ucsb.edu/data/chirps)\n\nCadence\n: 1 Day\n\nTags\n:\n[chg](/earth-engine/datasets/tags/chg) [climate](/earth-engine/datasets/tags/climate) [geophysical](/earth-engine/datasets/tags/geophysical) [precipitation](/earth-engine/datasets/tags/precipitation) [ucsb](/earth-engine/datasets/tags/ucsb) [weather](/earth-engine/datasets/tags/weather) \n\n#### Description\n\nClimate Hazards Center InfraRed Precipitation with Station data (CHIRPS)\nis a 30+ year quasi-global rainfall dataset. CHIRPS incorporates\n0.05° resolution satellite imagery with in-situ station data\nto create gridded rainfall time series for trend analysis and seasonal\ndrought monitoring.\n\n### Bands\n\n\n**Pixel Size**\n\n5566 meters\n\n**Bands**\n\n| Name | Units | Min | Max | Pixel Size | Description |\n|-----------------|-------|-----|-----------|------------|---------------|\n| `precipitation` | mm/d | 0\\* | 1444.34\\* | meters | Precipitation |\n\n\\* estimated min or max value\n\n### Terms of Use\n\n**Terms of Use**\n\nThis datasets are in the public domain. To the extent possible under law,\n[Pete Peterson](https://chc.ucsb.edu/people/pete-peterson)\nhas waived all copyright and related or neighboring rights to\nClimate Hazards Center Infrared Precipitation with Stations (CHIRPS).\n\n### Citations\n\nCitations:\n\n- Funk, Chris, Pete Peterson, Martin Landsfeld, Diego Pedreros, James\n Verdin, Shraddhanand Shukla, Gregory Husak, James Rowland, Laura Harrison,\n Andrew Hoell \\& Joel Michaelsen. \"The climate hazards infrared precipitation\n with stations-a new environmental record for monitoring extremes\".\n Scientific Data 2, 150066. [doi:10.1038/sdata.2015.66](https://doi.org/10.1038/sdata.2015.66)\n 2015.\n\n### Explore with Earth Engine\n\n| **Important:** Earth Engine is a platform for petabyte-scale scientific analysis and visualization of geospatial datasets, both for public benefit and for business and government users. Earth Engine is free to use for research, education, and nonprofit use. To get started, please [register for Earth Engine access.](https://console.cloud.google.com/earth-engine)\n\n### Code Editor (JavaScript)\n\n```javascript\nvar dataset = ee.ImageCollection('UCSB-CHG/CHIRPS/DAILY')\n .filter(ee.Filter.date('2018-05-01', '2018-05-03'));\nvar precipitation = dataset.select('precipitation');\nvar precipitationVis = {\n min: 1,\n max: 17,\n palette: ['001137', '0aab1e', 'e7eb05', 'ff4a2d', 'e90000'],\n};\nMap.setCenter(17.93, 7.71, 2);\nMap.addLayer(precipitation, precipitationVis, 'Precipitation');\n```\nPython setup\n\nSee the [Python Environment](/earth-engine/guides/python_install) page for information on the Python API and using\n`geemap` for interactive development. \n\n```python\nimport ee\nimport geemap.core as geemap\n```\n\n### Colab (Python)\n\n```python\ndataset = ee.ImageCollection('UCSB-CHG/CHIRPS/DAILY').filter(\n ee.Filter.date('2018-05-01', '2018-05-03')\n)\nprecipitation = dataset.select('precipitation')\nprecipitation_vis = {\n 'min': 1,\n 'max': 17,\n 'palette': ['001137', '0aab1e', 'e7eb05', 'ff4a2d', 'e90000'],\n}\n\nm = geemap.Map()\nm.set_center(17.93, 7.71, 2)\nm.add_layer(precipitation, precipitation_vis, 'Precipitation')\nm\n```\n[Open in Code Editor](https://code.earthengine.google.com/?scriptPath=Examples:Datasets/UCSB-CHG/UCSB-CHG_CHIRPS_DAILY) \n[CHIRPS Daily: Climate Hazards Center InfraRed Precipitation With Station Data (Version 2.0 Final)](/earth-engine/datasets/catalog/UCSB-CHG_CHIRPS_DAILY) \nClimate Hazards Center InfraRed Precipitation with Station data (CHIRPS) is a 30+ year quasi-global rainfall dataset. CHIRPS incorporates 0.05° resolution satellite imagery with in-situ station data to create gridded rainfall time series for trend analysis and seasonal drought monitoring. \nUCSB-CHG/CHIRPS/DAILY, chg,climate,geophysical,precipitation,ucsb,weather \n1981-01-01T00:00:00Z/2025-07-31T00:00:00Z \n-50 -180 50 180 \nGoogle Earth Engine \nhttps://developers.google.com/earth-engine/datasets\n\n- [](https://doi.org/https://chc.ucsb.edu/data/chirps)\n- [](https://doi.org/https://developers.google.com/earth-engine/datasets/catalog/UCSB-CHG_CHIRPS_DAILY)"]]