- 資料集可用性
- 1981-01-01T00:00:00Z–2025-10-31T00:00:00Z
- 資料集供應來源
- UCSB/CHG
- 更新頻率
- 1 天
- 標記
說明
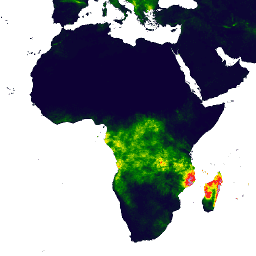
氣候災害中心紅外線降水資料 (含測站資料) (CHIRPS) 是 30 多年來的準全球降雨量資料集。CHIRPS 結合 0.05° 解析度的衛星影像和現場觀測站資料,建立格狀降雨時間序列,用於趨勢分析和季節性乾旱監測。
錶帶
像素大小
5566 公尺
波段
| 名稱 | 單位 | 最小值 | 最大值 | 像素大小 | 說明 |
|---|---|---|---|---|---|
precipitation |
公釐/天 | 0* | 1444.34* | 公尺 | 降水率 |
使用條款
使用條款
這些資料集屬於公版資源。在法律允許的範圍內,Pete Peterson 已放棄「Climate Hazards Center Infrared Precipitation with Stations (CHIRPS)」的所有著作權和相關或鄰近權利。
參考資料
參考資料:
Funk, Chris, Pete Peterson, Martin Landsfeld, Diego Pedreros, James Verdin, Shraddhanand Shukla, Gregory Husak, James Rowland, Laura Harrison, Andrew Hoell & Joel Michaelsen. 「The climate hazards infrared precipitation with stations-a new environmental record for monitoring extremes」。Scientific Data 2, 150066. doi:10.1038/sdata.2015.66 2015.
使用 Earth Engine 探索
程式碼編輯器 (JavaScript)
var dataset = ee.ImageCollection('UCSB-CHG/CHIRPS/DAILY')
                  .filter(ee.Filter.date('2018-05-01', '2018-05-03'));
var precipitation = dataset.select('precipitation');
var precipitationVis = {
  min: 1,
  max: 17,
  palette: ['001137', '0aab1e', 'e7eb05', 'ff4a2d', 'e90000'],
};
Map.setCenter(17.93, 7.71, 2);
Map.addLayer(precipitation, precipitationVis, 'Precipitation');
import ee
import geemap.core as geemap
Colab (Python)
dataset = ee.ImageCollection('UCSB-CHG/CHIRPS/DAILY').filter(
    ee.Filter.date('2018-05-01', '2018-05-03')
)
precipitation = dataset.select('precipitation')
precipitation_vis = {
    'min': 1,
    'max': 17,
    'palette': ['001137', '0aab1e', 'e7eb05', 'ff4a2d', 'e90000'],
}

m = geemap.Map()
m.set_center(17.93, 7.71, 2)
m.add_layer(precipitation, precipitation_vis, 'Precipitation')
m