O produto de dados de temperatura diária do Climate Hazards Center InfraRed Temperature with Stations (CHIRTS-daily; Verdin et al. 2020) é um conjunto de dados em grade quase global de alta resolução (0, 05° × 0, 05° de resolução, 60°S a 70°N) que fornece temperaturas diárias mínimas (Tmin) e máximas de 2 metros (Tmax) e quatro variáveis derivadas: pressão de vapor de saturação (SVP), déficit de pressão de vapor (VPD), umidade relativa (RH) e índice de calor (HI).
Os produtos de temperatura CHIRTS foram criados para oferecer suporte à análise de extremos e variabilidade de temperatura, especialmente em regiões com baixa densidade de observações de estações.
O CHIRTS-daily é criado pela fusão de um conjunto de dados de temperatura máxima mensal de alta qualidade e resolução, o registro climático de temperatura máxima mensal do Centro de Riscos Climáticos InfraRed com Estações (CHIRTSmax; Funk et al. 2019), com temperaturas diárias da Reanálise v5 (ERA5) do Centro Europeu para Previsões Meteorológicas de Médio Alcance (ECMWF).
O resultado é um conjunto de dados de temperatura diária de alta resolução que mantém informações espaço-temporais do CHIRTSmax mensal e a variabilidade de temperatura diária e diurna do ERA5. Os CHIRTSmax mensais são baseados em:
Uma climatologia de Tmax construída usando regressões geoestatísticas e médias de longo prazo de observações de estações da FAO, temperaturas do ERA5 e vários outros preditores geográficos.
Estimativas da variabilidade de Tmax usando aproximadamente 15.000 observações in situ e observações de satélite de alta resolução (0,05° × 0,05°).
Esses dados são de relatórios de estações da Berkeley Earth e do Sistema Global de Telecomunicações (GTS, na sigla em inglês) e de temperaturas de brilho infravermelho térmico de satélites geoestacionários GridSat com triagem de nuvens.
Os valores diários de Tmax são produzidos usando anomalias de Tmax do ERA5 reduzidas e CHIRTSmax de alta resolução. Os valores diários de Tmin são criados removendo o intervalo de temperatura diurna reduzido do ERA5 (Tmax - Tmin).
Os valores diários de SVP, VPD, RH e HI são calculados usando Tmin e Tmax diários do CHIRTS, além de entradas horárias do ERA5 para outras variáveis meteorológicas (consulte Williams et al., 2024, para mais detalhes). CHIRTS-diário, versão 1, abrange o período de 1983 a 2016.
Bandas
Tamanho do pixel 5566 metros
Bandas
Nome
Unidades
Mín.
Máx.
Tamanho do pixel
Descrição
minimum_temperature
°C
metros
A temperatura mais baixa do ar registrada a 2 metros acima da superfície do solo em um período de 24 horas.
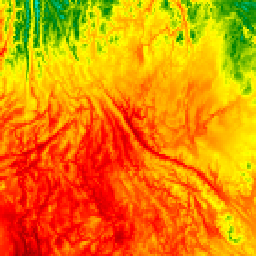
maximum_temperature
°C
10*
40*
metros
A maior temperatura do ar registrada a 2 metros acima da superfície do solo em um período de 24 horas.
saturation_vapor_pressure
kPa
metros
A quantidade máxima de vapor de água que o ar pode conter em uma determinada temperatura e pressão a 2 metros acima do solo.
vapor_pressure_deficit
kPa
metros
A diferença entre a pressão de vapor de saturação e a pressão de vapor real a 2 metros acima do solo.
relative_humidity
%
metros
A proporção entre a quantidade real de vapor de água no ar e a quantidade máxima que ele pode conter nessa temperatura e pressão (pressão de vapor de saturação) a 2 metros acima do solo.
heat_index
°F
metros
Uma medida de como está a sensação térmica quando a temperatura e a umidade são combinadas.
* valor mínimo ou máximo estimado
Termos de Uso
Termos de Uso
Esses conjuntos de dados estão em domínio público. Na medida do possível de acordo com a lei, Chris Funk renunciou a todos os direitos autorais e direitos relacionados ou vizinhos ao produto de dados de temperatura diária de temperatura infravermelha de riscos climáticos com estações (CHIRTS-diário).
Citações
Citações:
Verdin, A., C. Funk, P. Peterson, M. Landsfeld, C. Tuholske e Grace, K.,
2020: desenvolvimento e validação do conjunto de dados de temperatura diária de alta resolução quase global do CHIRTS. Scientific Data, 7(1), 303.
doi: 10.1038/s41597-020-00643-7
Funk, C., P. Peterson, S. Peterson, S. Shukla,
F. Davenport, J. Michaelsen, K.R. Knapp, M. Landsfeld, G. Husak,
L. Harrison, J. Rowland, M. Budde, A. Meiburg, T. Dinku, D. Pedreros,
and N. Mata, 2019: um registro de dados climáticos de alta resolução de Tmax de 1983 a 2016 com base em temperaturas infravermelhas e estações do Climate Hazard Center. J. Climate, 32, 5639-5658.
doi:10.1175/JCLI-D-18-0698.1
Williams, E., C. Funk, P. Peterson, and C. Tuholske (2024). Observações e projeções de alta resolução sobre mudanças climáticas para a avaliação de extremos relacionados ao calor. Scientific Data, 11(1), 261.
doi: 10.1038/s41597-024-03074-w
O produto de dados de temperatura diária do Centro de Riscos Climáticos InfraRed com Estações (CHIRTS-diário; Verdin et al. 2020) é um conjunto de dados em grade quase global de alta resolução (resolução de 0,05° × 0,05°, 60°S - 70°N) que fornece temperaturas mínimas (Tmin) e máximas (Tmax) diárias de 2 metros e quatro variáveis derivadas: pressão de vapor de saturação (SVP), déficit de pressão de vapor…
[null,null,[],[[["\u003cp\u003eCHIRTS-daily provides daily minimum and maximum 2-meter temperatures globally at a 0.05° × 0.05° resolution from 1983 to 2016.\u003c/p\u003e\n"],["\u003cp\u003eThe dataset also includes derived variables: saturation vapor pressure, vapor pressure deficit, relative humidity, and heat index.\u003c/p\u003e\n"],["\u003cp\u003eCHIRTS-daily merges high-resolution monthly maximum temperatures with daily temperatures from the European Centre for Medium-Range Weather Forecasts (ECMWF) Reanalysis v5 (ERA5).\u003c/p\u003e\n"],["\u003cp\u003eThis dataset is designed to support the analysis of temperature extremes and variability, particularly in data-sparse regions.\u003c/p\u003e\n"],["\u003cp\u003eCHIRTS-daily is publicly available and provided by UCSB/CHG.\u003c/p\u003e\n"]]],[],null,["# CHIRTS-daily: Climate Hazards Center InfraRed Temperature with Stations daily temperature data product\n\nDataset Availability\n: 1983-01-01T00:00:00Z--2016-12-31T00:00:00Z\n\nDataset Provider\n:\n\n\n [UCSB/CHG](https://chc.ucsb.edu/data/chirtsdaily)\n\nCadence\n: 1 Day\n\nTags\n:\n[chg](/earth-engine/datasets/tags/chg) [climate](/earth-engine/datasets/tags/climate) [daily](/earth-engine/datasets/tags/daily) [era5](/earth-engine/datasets/tags/era5) [geophysical](/earth-engine/datasets/tags/geophysical) [reanalysis](/earth-engine/datasets/tags/reanalysis) [temperature](/earth-engine/datasets/tags/temperature) [ucsb](/earth-engine/datasets/tags/ucsb) [wind](/earth-engine/datasets/tags/wind) \n\n#### Description\n\nThe Climate Hazards Center InfraRed Temperature with Stations daily\ntemperature data product (CHIRTS-daily; Verdin et al. 2020) is a quasi\nglobal, high-resolution gridded dataset\n(0.05° × 0.05° resolution, 60°S - 70°N)\nthat provides daily minimum (Tmin) and maximum 2-meter temperatures (Tmax)\nand four derived variables: saturation vapor pressure (SVP),\nvapor pressure deficit (VPD), relative humidity (RH), and heat index (HI).\nCHIRTS temperature products are designed to support analysis of temperature\nextremes and variability, especially in regions with a low density of\nstation observations.\n\nCHIRTS-daily is created by merging a high-quality, high-resolution monthly\nmaximum temperature dataset, the Climate Hazards Center InfraRed\nTemperature with Stations monthly maximum temperature climate record\n(CHIRTSmax; Funk et al. 2019), with daily temperatures from the European\nCentre for Medium-Range Weather Forecasts (ECMWF) Reanalysis v5 (ERA5).\nThe result is a high-resolution, daily temperature dataset that maintains\nspatio-temporal information from monthly CHIRTSmax and the daily and diurnal\ntemperature variability from ERA5. Monthly CHIRTSmax are based on:\n\n1. A Tmax climatology constructed using geostatistical regressions and\n long-term averages of FAO station observations, ERA5 temperatures, and\n several other geographic predictors.\n\n2. Estimates of Tmax variability using approximately 15,000 in situ\n observations and high-resolution\n (0.05° × 0.05°) satellite observations.\n These data are from Berkeley Earth and Global Telecommunication\n System (GTS) station reports and cloud-screened GridSat geostationary\n satellite thermal infrared brightness temperatures.\n\nDaily Tmax values are produced using downscaled ERA5 Tmax anomalies and\nhigh-resolution CHIRTSmax. Daily Tmin values are created by removing the\ndownscaled ERA5 diurnal temperature range (Tmax - Tmin).\nDaily SVP, VPD, RH, and HI are computed using CHIRTS-daily Tmin and Tmax,\nalongside hourly ERA5 inputs for other meteorological variables\n(see Williams et al., 2024, for details). CHIRTS-daily, version 1, covers\nthe period from 1983 to 2016.\n\n### Bands\n\n\n**Pixel Size**\n\n5566 meters\n\n**Bands**\n\n| Name | Units | Min | Max | Pixel Size | Description |\n|-----------------------------|-------|------|------|------------|-------------------------------------------------------------------------------------------------------------------------------------------------------------------------------------|\n| `minimum_temperature` | °C | | | meters | The lowest air temperature recorded at 2 meters above the ground surface over a 24-hour period. |\n| `maximum_temperature` | °C | 10\\* | 40\\* | meters | The highest air temperature recorded at 2 meters above the ground surface over a 24-hour period. |\n| `saturation_vapor_pressure` | kPa | | | meters | The maximum amount of water vapor that the air can hold at a given temperature and pressure at 2 meters above ground. |\n| `vapor_pressure_deficit` | kPa | | | meters | The difference between the saturation vapor pressure and the actual vapor pressure at 2 meters above ground. |\n| `relative_humidity` | % | | | meters | The ratio of the actual amount of water vapor in the air to the maximum amount it could hold at that temperature and pressure (saturation vapor pressure) at 2 meters above ground. |\n| `heat_index` | °F | | | meters | A measure of how hot it feels when temperature and humidity are combined. |\n\n\\* estimated min or max value\n\n### Terms of Use\n\n**Terms of Use**\n\nThis datasets are in the public domain. To the extent possible under law,\n[Chris Funk](https://chc.ucsb.edu/people/chris-funk) has waived all\ncopyright and related or neighboring rights to Climate Hazards InfraRed\nTemperature with Stations daily temperature data product (CHIRTS-daily).\n\n### Citations\n\nCitations:\n\n- Verdin, A., C. Funk, P. Peterson, M. Landsfeld, C. Tuholske, and Grace, K.,\n 2020: Development and validation of the CHIRTS-daily quasi-global\n high-resolution daily temperature data set. Scientific Data, 7(1), 303.\n [doi: 10.1038/s41597-020-00643-7](https://doi.org/10.1038/s41597-020-00643-7)\n- Funk, C., P. Peterson, S. Peterson, S. Shukla,\n F. Davenport, J. Michaelsen, K.R. Knapp, M. Landsfeld, G. Husak,\n L. Harrison, J. Rowland, M. Budde, A. Meiburg, T. Dinku, D. Pedreros,\n and N. Mata, 2019: A High-Resolution 1983-2016 Tmax Climate Data Record\n Based on Infrared Temperatures and Stations by the Climate Hazard\n Center. J. Climate, 32, 5639-5658.\n [doi:10.1175/JCLI-D-18-0698.1](https://doi.org/10.1175/JCLI-D-18-0698.1)\n- Williams, E., C. Funk, P. Peterson, and C. Tuholske (2024). High\n resolution climate change observations and projections for the\n evaluation of heat-related extremes. Scientific Data, 11(1), 261.\n [doi: 10.1038/s41597-024-03074-w](https://doi.org/10.1038/s41597-024-03074-w)\n\n### DOIs\n\n- \u003chttps://doi.org/10.1038/s41597-024-03074-w\u003e\n- \u003chttps://doi.org/10.1175/JCLI-D-18-0698.1\u003e\n\n### Explore with Earth Engine\n\n| **Important:** Earth Engine is a platform for petabyte-scale scientific analysis and visualization of geospatial datasets, both for public benefit and for business and government users. Earth Engine is free to use for research, education, and nonprofit use. To get started, please [register for Earth Engine access.](https://console.cloud.google.com/earth-engine)\n\n### Code Editor (JavaScript)\n\n```javascript\nvar dataset = ee.ImageCollection('UCSB-CHG/CHIRTS/DAILY')\n .filter(ee.Filter.date('2016-05-01', '2016-05-03'));\nvar maximumTemperature = dataset.select('maximum_temperature');\nvar visParams = {\n min: 10,\n max: 30,\n palette: ['darkblue', 'blue', 'cyan', 'green', 'yellow', 'orange', 'red','darkred'],\n};\nMap.setCenter(-104.28, 46.07, 3);\nMap.addLayer(maximumTemperature, visParams, 'Maximum temperature');\n```\n[Open in Code Editor](https://code.earthengine.google.com/?scriptPath=Examples:Datasets/UCSB-CHG/UCSB-CHG_CHIRTS_DAILY) \n[CHIRTS-daily: Climate Hazards Center InfraRed Temperature with Stations daily temperature data product](/earth-engine/datasets/catalog/UCSB-CHG_CHIRTS_DAILY) \nThe Climate Hazards Center InfraRed Temperature with Stations daily temperature data product (CHIRTS-daily; Verdin et al. 2020) is a quasi global, high-resolution gridded dataset (0.05° × 0.05° resolution, 60°S - 70°N) that provides daily minimum (Tmin) and maximum 2-meter temperatures (Tmax) and four derived variables: saturation vapor pressure (SVP), vapor pressure deficit ... \nUCSB-CHG/CHIRTS/DAILY, chg,climate,daily,era5,geophysical,reanalysis,temperature,ucsb,wind \n1983-01-01T00:00:00Z/2016-12-31T00:00:00Z \n-60 -180 70 180 \nGoogle Earth Engine \nhttps://developers.google.com/earth-engine/datasets\n\n- [https://doi.org/10.1175/JCLI-D-18-0698.1](https://doi.org/https://chc.ucsb.edu/data/chirtsdaily)\n- [https://doi.org/10.1175/JCLI-D-18-0698.1](https://doi.org/https://developers.google.com/earth-engine/datasets/catalog/UCSB-CHG_CHIRTS_DAILY)"]]