- Disponibilité de l'ensemble de données
- 1983-01-01T00:00:00Z–2016-12-31T00:00:00Z
- Producteur de l'ensemble de données
- UCSB
- Fréquence de mise à jour
- 1 jour
- Tags
Description
CHC-CMIP6 a été explicitement développé pour permettre l'analyse des risques liés au climat au cours du passé récent et dans un avenir proche.
Cet ensemble de données de projections climatiques contient des données mondiales quotidiennes sous forme de grille pour les périodes d'observation (1983-2016) et de projection (2030 et 2050). Il doit être utilisé pour identifier et surveiller les extrêmes hydroclimatiques. L'ensemble de données contient des grilles mondiales quotidiennes haute résolution (0, 05°) du produit de température CHIRTS-daily (Climate Hazards InfraRed Temperature with Stations), du produit de précipitations CHIRPS (Climate Hazards InfraRed Precipitation with Stations) et de l'humidité relative dérivée d'ERA5, à partir desquelles ont été dérivés les déficits de pression de vapeur (VPD) et les températures maximales du thermomètre globe mouillé (WBGTmax).
De grands ensembles CMIP6 issus des scénarios SSP 245 et SSP 585 (Shared Socioeconomic Pathway) ont été utilisés pour développer des champs delta quotidiens haute résolution (0,05°) pour 2030 et 2050.
Pour en savoir plus, consultez The Climate Hazards Center (CHC) Coupled Model Intercomparison Project Phase 6 (CHC-CMIP6).
Bandes
Bandes de fréquences
Taille des pixels : 5 566 mètres (toutes les bandes)
| Nom | Unités | Min | Max | Taille des pixels | Description |
|---|---|---|---|---|---|
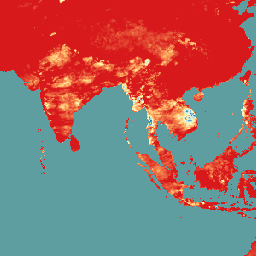
CHIRPS |
mm/d | 0 | 751,05 | 5 566 mètres | Précipitations totales quotidiennes. |
himax |
°C | -49.76 | 78.56 | 5 566 mètres | Indice de chaleur maximal quotidien. |
RH |
% | -1.33 | 100 | 5 566 mètres | Humidité relative. |
RHx |
% | -3.11 | 100 | 5 566 mètres | Humidité relative à l'heure de température maximale |
RHn |
% | -2.603 | 100 | 5 566 mètres | Humidité relative à l'heure de la température minimale. |
wbgtmax |
°C | -100,54 | 33.76 | 5 566 mètres | Température maximale quotidienne au thermomètre-globe mouillé. |
vpd |
kPa | 0 | 67.98 | 5 566 mètres | Déficit de pression de vapeur quotidien. |
svp |
kPa | 0,011 | 71,41 | 5 566 mètres | Pression de vapeur saturante quotidienne moyenne. |
Tmax |
°C | -43.04 | 90,52 | 5 566 mètres | Température maximale quotidienne de l'air près de la surface. |
Tmin |
°C | -46,72 | 89,82 | 5 566 mètres | Température de l'air quotidienne minimale près de la surface. |
Propriétés des images
Propriétés des images
| Nom | Type | Description |
|---|---|---|
| projection_year | INT | Année de projection |
| scénario | STRING | Scénarios de voies socio-économiques partagées (SSP) |
Conditions d'utilisation
Conditions d'utilisation
L'ensemble de données est soumis à la licence Creative Commons Attribution 4.0 International (CC BY 4.0). Pour en savoir plus, consultez The Climate Hazards Center (CHC) Coupled Model Intercomparison Project Phase 6 (CHC-CMIP6).
Citations
Williams, E., Funk, C., Peterson, P., & Tuholske, C. (2024). Observations et projections à haute résolution sur le changement climatique pour l'évaluation des extrêmes liés à la chaleur. Scientific Data, 11(1), 261. https://www.nature.com/articles/s41597-024-03074-w 2015.
Explorer avec Earth Engine
Éditeur de code (JavaScript)
var dataset = ee.ImageCollection('UCSB/CHC/CMIP6/v1')
                  .filter(ee.Filter.date('2016-08-01', '2016-08-30'));
var chirps = dataset.select('CHIRPS');
var chirpsVis = {
  min: 0,
  max: 100.0,
  palette: ['d7191c', 'fdae61', 'ffffbf', 'abd9e9', '2c7bb6'],
};
Map.setCenter(93.17, 10.14, 4);
Map.addLayer(chirps, chirpsVis, 'CHC CMIP6');