CHC-CMIP6 secara eksplisit dikembangkan untuk mendukung analisis bahaya terkait iklim dalam waktu dekat dan di masa lalu.
Set data proyeksi iklim ini berisi data berpetak harian global untuk periode observasi (1983-2016) dan proyeksi (2030 dan 2050) yang akan digunakan dalam identifikasi dan pemantauan ekstrem hidroiklim. Set data
berisi petak resolusi tinggi harian global (0,05°) dari produk suhu Climate
Hazards InfraRed Temperature with Stations (CHIRTS-daily), produk presipitasi Climate Hazards InfraRed Precipitation with Stations (CHIRPS), dan kelembapan relatif yang berasal dari ERA5, yang darinya Vapor Pressure Deficits (VPD) dan Wet Bulb Globe Temperatures (WBGTmax) maksimum diturunkan.
Ensemble CMIP6 besar dari skenario Shared Socioeconomic Pathway (SSP) 245 dan SSP 585 digunakan untuk mengembangkan kolom delta harian beresolusi tinggi (0,05°) tahun 2030 dan 2050.
Williams, E., Funk, C., Peterson, P., & Tuholske, C. (2024). Pengamatan dan proyeksi perubahan iklim beresolusi tinggi untuk evaluasi ekstremitas terkait panas. Scientific Data, 11(1), 261.
https://www.nature.com/articles/s41597-024-03074-w
2015.
CHC-CMIP6 secara eksplisit dikembangkan untuk mendukung analisis bahaya terkait iklim dalam waktu dekat dan di masa lalu. Set data proyeksi iklim ini berisi data bergrid harian global untuk periode pengamatan (1983-2016) dan proyeksi (2030 dan 2050) yang akan digunakan dalam identifikasi dan pemantauan ekstremitas hidroiklim. …
[null,null,[],[],[],null,["# The Climate Hazards Center (CHC) Coupled Model Intercomparison Project Phase 6 (CHC-CMIP6)\n\nDataset Availability\n: 1983-01-01T00:00:00Z--2016-12-31T00:00:00Z\n\nDataset Provider\n:\n\n\n [UCSB](https://chc.ucsb.edu/data/chc-cmip6)\n\nCadence\n: 1 Day\n\nTags\n:\n[climate](/earth-engine/datasets/tags/climate) [geophysical](/earth-engine/datasets/tags/geophysical) [precipitation](/earth-engine/datasets/tags/precipitation) [ucsb](/earth-engine/datasets/tags/ucsb) [weather](/earth-engine/datasets/tags/weather) \n\n#### Description\n\nCHC-CMIP6 was explicitly developed to support the analysis of\nclimate-related hazards over the recent past and in the near-future.\n\nThis climate projection dataset contains global, daily gridded data for the\nobservational (1983-2016) and projection (2030 and 2050) periods to be used\nin the identification and monitoring of hydroclimatic extremes. The dataset\ncontains global daily high resolution (0.05°) grids of the Climate\nHazards InfraRed Temperature with Stations (CHIRTS-daily) temperature\nproduct, the Climate Hazards InfraRed Precipitation with Stations (CHIRPS)\nprecipitation product, and ERA5-derived relative humidity, from which Vapor\nPressure Deficits (VPD) and maximum Wet Bulb Globe Temperatures (WBGTmax)\nwere derived.\n\nLarge CMIP6 ensembles from the Shared Socioeconomic Pathway (SSP) 245 and\nSSP 585 scenarios were used to develop high resolution (0.05°) daily\n2030 and 2050 delta fields.\n\nFor more information, see\n[The Climate Hazards Center (CHC) Coupled Model Intercomparison Project\nPhase 6 (CHC-CMIP6)](https://chc.ucsb.edu/data/chc-cmip6).\n\n### Bands\n\n\n**Pixel Size**\n\n5566 meters\n\n**Bands**\n\n| Name | Units | Min | Max | Pixel Size | Description |\n|-----------|-------|---------|--------|------------|-------------------------------------------------------|\n| `CHIRPS` | mm/d | 0 | 751.05 | meters | Daily total precipitation. |\n| `himax` | °C | -49.76 | 78.56 | meters | Daily maximum Heat Index. |\n| `RH` | % | -1.33 | 100 | meters | Relative Humidity. |\n| `RHx` | % | -3.11 | 100 | meters | Relative humidity at the hour of maximum temperature |\n| `RHn` | % | -2.603 | 100 | meters | Relative humidity at the hour of minimum temperature. |\n| `wbgtmax` | °C | -100.54 | 33.76 | meters | Daily maximum wet bulb globe temperature. |\n| `vpd` | kPa | 0 | 67.98 | meters | Daily vapor pressure deficit. |\n| `svp` | kPa | 0.011 | 71.41 | meters | Daily average saturation vapor pressure. |\n| `Tmax` | °C | -43.04 | 90.52 | meters | Daily maximum near-surface air temperature. |\n| `Tmin` | °C | -46.72 | 89.82 | meters | Daily minimum near-surface air temperature. |\n\n### Image Properties\n\n**Image Properties**\n\n| Name | Type | Description |\n|-----------------|--------|----------------------------------------------|\n| projection_year | INT | Projection Year |\n| scenario | STRING | Shared Socioeconomic Pathway (SSP) scenarios |\n\n### Terms of Use\n\n**Terms of Use**\n\nThe dataset is under a Creative Commons Attribution 4.0 International\n(CC BY 4.0) license. For more information, see\n[The Climate Hazards Center (CHC) Coupled Model Intercomparison Project\nPhase 6 (CHC-CMIP6)](https://chc.ucsb.edu/data/chc-cmip6).\n\n### Citations\n\nCitations:\n\n- Williams, E., Funk, C., Peterson, P., \\& Tuholske, C. (2024). High resolution\n climate change observations and projections for the evaluation of\n heat-related extremes. Scientific Data, 11(1), 261.\n \u003chttps://www.nature.com/articles/s41597-024-03074-w\u003e\n 2015.\n\n### Explore with Earth Engine\n\n| **Important:** Earth Engine is a platform for petabyte-scale scientific analysis and visualization of geospatial datasets, both for public benefit and for business and government users. Earth Engine is free to use for research, education, and nonprofit use. To get started, please [register for Earth Engine access.](https://console.cloud.google.com/earth-engine)\n\n### Code Editor (JavaScript)\n\n```javascript\n
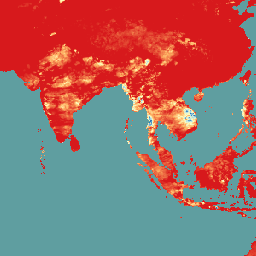
var dataset = ee.ImageCollection('UCSB/CHC/CMIP6/v1')\n .filter(ee.Filter.date('2016-08-01', '2016-08-30'));\nvar chirps = dataset.select('CHIRPS');\nvar chirpsVis = {\n min: 0,\n max: 100.0,\n palette: ['d7191c', 'fdae61', 'ffffbf', 'abd9e9', '2c7bb6'],\n};\nMap.setCenter(93.17, 10.14, 4);\nMap.addLayer(chirps, chirpsVis, 'CHC CMIP6');\n```\n[Open in Code Editor](https://code.earthengine.google.com/?scriptPath=Examples:Datasets/UCSB/UCSB_CHC_CMIP6_v1) \n[The Climate Hazards Center (CHC) Coupled Model Intercomparison Project Phase 6 (CHC-CMIP6)](/earth-engine/datasets/catalog/UCSB_CHC_CMIP6_v1) \nCHC-CMIP6 was explicitly developed to support the analysis of climate-related hazards over the recent past and in the near-future. This climate projection dataset contains global, daily gridded data for the observational (1983-2016) and projection (2030 and 2050) periods to be used in the identification and monitoring of hydroclimatic extremes. The ... \nUCSB/CHC/CMIP6/v1, climate,geophysical,precipitation,ucsb,weather \n1983-01-01T00:00:00Z/2016-12-31T00:00:00Z \n-50 -180 50 180 \nGoogle Earth Engine \nhttps://developers.google.com/earth-engine/datasets\n\n- [](https://doi.org/https://chc.ucsb.edu/data/chc-cmip6)\n- [](https://doi.org/https://developers.google.com/earth-engine/datasets/catalog/UCSB_CHC_CMIP6_v1)"]]