- Disponibilità set di dati
- 1983-01-01T00:00:00Z–2016-12-31T00:00:00Z
- Produttore del set di dati
- UCSB
- Cadenza
- 1 giorno
- Tag
Descrizione
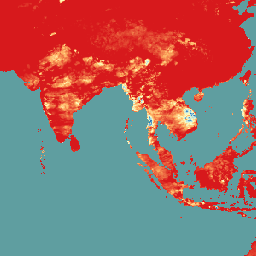
CHC-CMIP6 è stato sviluppato esplicitamente per supportare l'analisi dei pericoli legati al clima nel recente passato e nel futuro prossimo.
Questo set di dati di proiezione climatica contiene dati globali giornalieri in formato griglia per i periodi di osservazione (1983-2016) e di proiezione (2030 e 2050) da utilizzare per l'identificazione e il monitoraggio degli estremi idroclimatici. Il set di dati contiene griglie globali giornaliere ad alta risoluzione (0, 05°) del prodotto di temperatura CHIRTS-daily (Climate Hazards InfraRed Temperature with Stations), del prodotto di precipitazioni CHIRPS (Climate Hazards InfraRed Precipitation with Stations) e dell'umidità relativa derivata da ERA5, da cui sono stati derivati i deficit di pressione di vapore (VPD) e le temperature Wet Bulb Globe massime (WBGTmax).
Sono stati utilizzati grandi ensemble CMIP6 degli scenari Shared Socioeconomic Pathway (SSP) 245 e SSP 585 per sviluppare campi delta giornalieri ad alta risoluzione (0,05°) per il 2030 e il 2050.
Per saperne di più, consulta The Climate Hazards Center (CHC) Coupled Model Intercomparison Project Phase 6 (CHC-CMIP6).
Bande
Bande
Dimensioni pixel: 5566 metri (tutte le bande)
| Nome | Unità | Min | Max | Dimensioni pixel | Descrizione |
|---|---|---|---|---|---|
CHIRPS |
mm/g | 0 | 751,05 | 5566 metri | Precipitazioni totali giornaliere. |
himax |
°C | -49,76 | 78,56 | 5566 metri | Indice di calore massimo giornaliero. |
RH |
% | -1,33 | 100 | 5566 metri | Umidità relativa. |
RHx |
% | -3.11 | 100 | 5566 metri | Umidità relativa all'ora di temperatura massima |
RHn |
% | -2.603 | 100 | 5566 metri | Umidità relativa all'ora di temperatura minima. |
wbgtmax |
°C | -100,54 | 33,76 | 5566 metri | Temperatura WBGT massima giornaliera. |
vpd |
kPa | 0 | 67.98 | 5566 metri | Deficit di pressione di vapore giornaliero. |
svp |
kPa | 0,011 | 71,41 | 5566 metri | Pressione di vapore saturo media giornaliera. |
Tmax |
°C | -43,04 | 90,52 | 5566 metri | Temperatura massima giornaliera dell'aria vicino alla superficie. |
Tmin |
°C | -46,72 | 89,82 | 5566 metri | Temperatura dell'aria vicino alla superficie minima giornaliera. |
Proprietà immagini
Proprietà immagini
| Nome | Tipo | Descrizione |
|---|---|---|
| projection_year | INT | Anno di proiezione |
| scenario | STRING | Scenari Shared Socioeconomic Pathway (SSP) |
Termini e condizioni d'uso
Termini e condizioni d'uso
Il set di dati è soggetto a una licenza Creative Commons Attribution 4.0 International (CC BY 4.0). Per saperne di più, consulta The Climate Hazards Center (CHC) Coupled Model Intercomparison Project Phase 6 (CHC-CMIP6).
Citazioni
Williams, E., Funk, C., Peterson, P., & Tuholske, C. (2024). Osservazioni e proiezioni ad alta risoluzione sui cambiamenti climatici per la valutazione di eventi estremi correlati al calore. Scientific Data, 11(1), 261. https://www.nature.com/articles/s41597-024-03074-w 2015.
Esplora con Earth Engine
Editor di codice (JavaScript)
var dataset = ee.ImageCollection('UCSB/CHC/CMIP6/v1')
                  .filter(ee.Filter.date('2016-08-01', '2016-08-30'));
var chirps = dataset.select('CHIRPS');
var chirpsVis = {
  min: 0,
  max: 100.0,
  palette: ['d7191c', 'fdae61', 'ffffbf', 'abd9e9', '2c7bb6'],
};
Map.setCenter(93.17, 10.14, 4);
Map.addLayer(chirps, chirpsVis, 'CHC CMIP6');