- 데이터 세트 제공
- 1983-01-01T00:00:00Z–2016-12-31T00:00:00Z
- 데이터 세트 출처
- UCSB
- 주기
- 1일
- 태그
설명
CHC-CMIP6는 최근 과거와 가까운 미래의 기후 관련 위험 분석을 지원하기 위해 명시적으로 개발되었습니다.
이 기후 예측 데이터 세트에는 수문기후 극단치 식별 및 모니터링에 사용되는 관측 (1983~2016년) 및 예측 (2030년 및 2050년) 기간의 전 세계 일일 그리드 데이터가 포함되어 있습니다. 이 데이터 세트에는 기후 위험 적외선 온도(관측소 포함)(CHIRTS-daily) 온도 제품, 기후 위험 적외선 강수량(관측소 포함)(CHIRPS) 강수량 제품, ERA5에서 파생된 상대 습도의 전 세계 일일 고해상도(0.05°) 그리드가 포함되어 있으며, 여기에서 증기압 부족(VPD)과 최대 습구 온도(WBGTmax)가 파생되었습니다.
공유 사회경제적 경로 (SSP) 245 및 SSP 585 시나리오의 대규모 CMIP6 앙상블을 사용하여 고해상도 (0.05°) 일일 2030년 및 2050년 델타 필드를 개발했습니다.
자세한 내용은 기후 위험 센터 (CHC) 결합 모델 비교 프로젝트 6단계 (CHC-CMIP6)를 참고하세요.
대역
대역
픽셀 크기: 5566미터 (모든 밴드)
| 이름 | 단위 | 최소 | 최대 | 픽셀 크기 | 설명 |
|---|---|---|---|---|---|
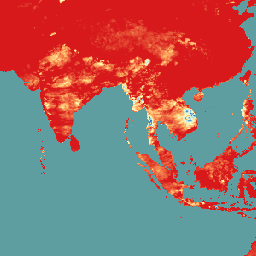
CHIRPS |
mm/d | 0 | 751.05 | 5566미터 | 일일 총 강수량입니다. |
himax |
°C | -49.76 | 78.56 | 5566미터 | 일일 최대 열 지수입니다. |
RH |
% | -1.33 | 100 | 5566미터 | 상대 습도 |
RHx |
% | -3.11 | 100 | 5566미터 | 최고 온도 시간의 상대 습도 |
RHn |
% | -2.603 | 100 | 5566미터 | 최저 온도 시간의 상대 습도입니다. |
wbgtmax |
°C | -100.54 | 33.76 | 5566미터 | 일일 최대 습구흑구온도입니다. |
vpd |
kPa | 0 | 67.98 | 5566미터 | 일일 증기압 부족량입니다. |
svp |
kPa | 0.011 | 71.41 | 5566미터 | 일일 평균 포화 증기압입니다. |
Tmax |
°C | -43.04 | 90.52 | 5566미터 | 일일 최대 지표면 기온입니다. |
Tmin |
°C | -46.72 | 89.82 | 5566미터 | 일일 최소 지표면 기온입니다. |
이미지 속성
이미지 속성
| 이름 | 유형 | 설명 |
|---|---|---|
| projection_year | INT | 예측 연도 |
| 시나리오 | 문자열 | 공유 사회경제적 경로 (SSP) 시나리오 |
이용약관
이용약관
데이터 세트는 크리에이티브 커먼즈 저작자 표시 4.0 국제(CC BY 4.0) 라이선스에 따라 제공됩니다. 자세한 내용은 기후 위험 센터 (CHC) 결합 모델 비교 프로젝트 6단계 (CHC-CMIP6)를 참고하세요.
인용
Williams, E., Funk, C., Peterson, P., & Tuholske, C. (2024년). 열 관련 극단값 평가를 위한 고해상도 기후 변화 관측 및 예측 Scientific Data, 11(1), 261. https://www.nature.com/articles/s41597-024-03074-w 2015.
Earth Engine으로 탐색
코드 편집기(JavaScript)
var dataset = ee.ImageCollection('UCSB/CHC/CMIP6/v1')
                  .filter(ee.Filter.date('2016-08-01', '2016-08-30'));
var chirps = dataset.select('CHIRPS');
var chirpsVis = {
  min: 0,
  max: 100.0,
  palette: ['d7191c', 'fdae61', 'ffffbf', 'abd9e9', '2c7bb6'],
};
Map.setCenter(93.17, 10.14, 4);
Map.addLayer(chirps, chirpsVis, 'CHC CMIP6');