- Disponibilidade do conjunto de dados
- 1983-01-01T00:00:00Z–2016-12-31T00:00:00Z
- Produtor de conjunto de dados
- UCSB
- Cadência
- 1 dia
- Tags
Descrição
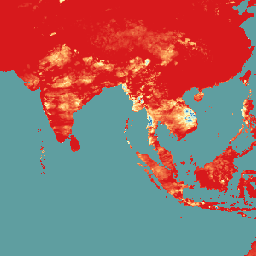
O CHC-CMIP6 foi desenvolvido explicitamente para apoiar a análise de riscos relacionados ao clima no passado recente e no futuro próximo.
Esse conjunto de dados de projeção climática contém dados globais e diários em grade para os períodos de observação (1983 a 2016) e projeção (2030 e 2050) a serem usados na identificação e no monitoramento de extremos hidroclimáticos. O conjunto de dados contém grades globais diárias de alta resolução (0, 05°) do produto de temperatura Climate Hazards InfraRed Temperature with Stations (CHIRTS-daily), do produto de precipitação Climate Hazards InfraRed Precipitation with Stations (CHIRPS) e da umidade relativa derivada do ERA5, de que foram derivados os déficits de pressão de vapor (VPD) e as temperaturas máximas de bulbo úmido e globo (WBGTmax).
Grandes conjuntos do CMIP6 dos cenários de trajetória socioeconômica compartilhada (SSP) 245 e 585 foram usados para desenvolver campos delta diários de alta resolução (0,05°) de 2030 e 2050.
Para mais informações, consulte Projeto de intercomparação de modelos acoplados da fase 6 do Centro de riscos climáticos (CHC-CMIP6).
Bandas
Bandas
Tamanho do pixel: 5.566 metros (todas as bandas)
| Nome | Unidades | Mín. | Máx. | Tamanho do pixel | Descrição |
|---|---|---|---|---|---|
CHIRPS |
mm/d | 0 | 751,05 | 5.566 metros | Precipitação total diária. |
himax |
°C | -49,76 | 78,56 | 5.566 metros | Índice de calor máximo diário. |
RH |
% | -1,33 | 100 | 5.566 metros | Umidade relativa. |
RHx |
% | -3,11 | 100 | 5.566 metros | Umidade relativa na hora da temperatura máxima |
RHn |
% | -2.603 | 100 | 5.566 metros | Umidade relativa na hora da temperatura mínima. |
wbgtmax |
°C | -100,54 | 33,76 | 5.566 metros | Temperatura máxima diária de bulbo úmido e globo. |
vpd |
kPa | 0 | 67,98 | 5.566 metros | Déficit diário de pressão de vapor. |
svp |
kPa | 0,011 | 71,41 | 5.566 metros | Média diária da pressão de vapor de saturação. |
Tmax |
°C | -43,04 | 90,52 | 5.566 metros | Temperatura máxima diária do ar perto da superfície. |
Tmin |
°C | -46,72 | 89,82 | 5.566 metros | Temperatura mínima diária do ar perto da superfície. |
Propriedades de imagens
Propriedades da imagem
| Nome | Tipo | Descrição |
|---|---|---|
| projection_year | INT | Ano da projeção |
| scenario | STRING | Cenários de trajetórias socioeconômicas compartilhadas (SSPs) |
Termos de Uso
Termos de Uso
O conjunto de dados está sob uma licença Creative Commons Atribuição 4.0 Internacional (CC BY 4.0). Para mais informações, consulte Projeto de intercomparação de modelos acoplados da fase 6 do Centro de riscos climáticos (CHC-CMIP6).
Citações
Williams, E., Funk, C., Peterson, P., & Tuholske, C. (2024). Observações e projeções de alta resolução sobre mudanças climáticas para a avaliação de extremos relacionados ao calor. Scientific Data, 11(1), 261. https://www.nature.com/articles/s41597-024-03074-w 2015.
Explore com o Earth Engine
Editor de código (JavaScript)
var dataset = ee.ImageCollection('UCSB/CHC/CMIP6/v1')
                  .filter(ee.Filter.date('2016-08-01', '2016-08-30'));
var chirps = dataset.select('CHIRPS');
var chirpsVis = {
  min: 0,
  max: 100.0,
  palette: ['d7191c', 'fdae61', 'ffffbf', 'abd9e9', '2c7bb6'],
};
Map.setCenter(93.17, 10.14, 4);
Map.addLayer(chirps, chirpsVis, 'CHC CMIP6');