- Disponibilidade do conjunto de dados
- 1960-01-01T00:00:00Z–1991-01-01T00:00:00Z
- Produtor de conjunto de dados
- University of California, Berkeley
- Tags
Descrição
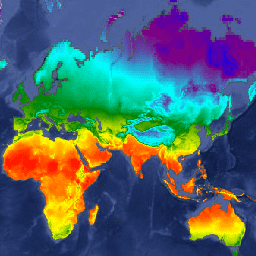
O WorldClim V1 Bioclim fornece variáveis bioclimáticas derivadas da temperatura e da precipitação mensais para gerar valores biologicamente mais significativos.
As variáveis bioclimáticas representam tendências anuais (por exemplo, temperatura média anual, precipitação anual), sazonalidade (por exemplo, variação anual de temperatura e precipitação) e fatores ambientais extremos ou limitantes (por exemplo, temperatura do mês mais frio e mais quente e precipitação dos trimestres úmido e seco).
O esquema de intervalos segue o do ANUCLIM, exceto que, para a sazonalidade da temperatura, foi usado o desvio padrão porque um coeficiente de variação não faz sentido com temperaturas entre -1 e 1.
A versão 1 do WorldClim foi desenvolvida por Robert J. Hijmans, Susan Cameron e Juan Parra, no Museu de Zoologia de Vertebrados, Universidade da Califórnia, Berkeley, em colaboração com Peter Jones e Andrew Jarvis (CIAT) e com Karen Richardson (Rainforest CRC).
Bandas
Bandas
Tamanho do pixel: 927,67 metros (todas as bandas)
| Nome | Unidades | Mín. | Máx. | Escala | Tamanho do pixel | Descrição |
|---|---|---|---|---|---|---|
bio01 |
°C | -29* | 32* | 0,1 | 927,67 metros | Temperatura média anual |
bio02 |
°C | 0.9* | 21.4* | 0,1 | 927,67 metros | Amplitude diurna média (média de (temperatura máxima mensal - temperatura mínima mensal)) |
bio03 |
% | 7* | 96* | 927,67 metros | Isotermalidade (bio02/bio07 * 100) |
|
bio04 |
°C | 0,62* | 227,21* | 0,01 | 927,67 metros | Sazonalidade de temperatura (desvio padrão * 100) |
bio05 |
°C | -9,6* | 49* | 0,1 | 927,67 metros | Temperatura máxima do mês mais quente |
bio06 |
°C | -57,3* | 25,8* | 0,1 | 927,67 metros | Temperatura mínima do mês mais frio |
bio07 |
°C | 5.3* | 72,5* | 0,1 | 927,67 metros | Intervalo anual de temperatura (bio05-bio06) |
bio08 |
°C | -28,5* | 37,8* | 0,1 | 927,67 metros | Temperatura média do trimestre mais úmido |
bio09 |
°C | -52,1* | 36,6* | 0,1 | 927,67 metros | Temperatura média do trimestre mais seco |
bio10 |
°C | -14,3* | 38.3* | 0,1 | 927,67 metros | Temperatura média do trimestre mais quente |
bio11 |
°C | -52,1* | 28,9* | 0,1 | 927,67 metros | Temperatura média do trimestre mais frio |
bio12 |
mm | 0* | 11401* | 927,67 metros | Precipitação anual |
|
bio13 |
mm | 0* | 2949* | 927,67 metros | Precipitação do mês mais chuvoso |
|
bio14 |
mm | 0* | 752* | 927,67 metros | Precipitação do mês mais seco |
|
bio15 |
Coeficiente de variação | 0* | 265* | 927,67 metros | Sazonalidade de precipitação |
|
bio16 |
mm | 0* | 8019* | 927,67 metros | Precipitação do trimestre mais úmido |
|
bio17 |
mm | 0* | 2495* | 927,67 metros | Precipitação do trimestre mais seco |
|
bio18 |
mm | 0* | 6090* | 927,67 metros | Precipitação do trimestre mais quente |
|
bio19 |
mm | 0* | 5162* | 927,67 metros | Precipitação do trimestre mais frio |
Termos de Uso
Termos de Uso
Citações
Hijmans, R.J., S.E. Cameron, J.L. Parra, P.G. Jones e A. Jarvis, 2005. Superfícies climáticas interpoladas de resolução muito alta para áreas terrestres globais. International Journal of Climatology 25: 1965-1978. doi:10.1002/joc.1276.
Explore com o Earth Engine
Editor de código (JavaScript)
var dataset = ee.Image('WORLDCLIM/V1/BIO');
var annualMeanTemperature = dataset.select('bio01').multiply(0.1);
var visParams = {
  min: -23,
  max: 30,
  palette: ['blue', 'purple', 'cyan', 'green', 'yellow', 'red'],
};
Map.setCenter(71.7, 52.4, 3);
Map.addLayer(annualMeanTemperature, visParams, 'Annual Mean Temperature');