Оптимизируйте свои подборки
Сохраняйте и классифицируйте контент в соответствии со своими настройками.
информация
Этот набор данных является частью каталога сообщества и не управляется Google Earth Engine. Свяжитесь с gee-community-catalog@googlegroups.com по поводу ошибок или просмотрите другие наборы данных в каталоге Awesome GEE Community Catalog. Подробнее о наборах данных сообщества .
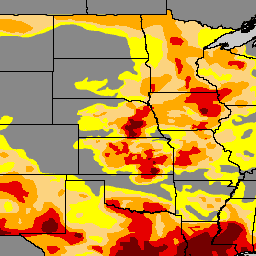
Монитор засух США (US Drought Monitor) – это карта, публикуемая каждый четверг, на которой показаны районы США, охваченные засухой. Карта использует пять уровней: аномально сухой (D0), показывающий районы, которые могут начать или выйти из состояния засухи, и четыре уровня засухи: умеренный (D1), сильный (D2), экстремальный (D3) и исключительный (D4). Монитор засух – это коллективный проект с момента его создания в 1999 году, совместно разработанный Национальным центром по смягчению последствий засухи (NDMC) при Университете Небраски-Линкольна, Национальным управлением океанических и атмосферных исследований (NOAA) и Министерством сельского хозяйства США (USDA). NDMC размещает веб-сайт монитора засух и связанные с ним данные, а также предоставляет карту и данные NOAA, USDA и другим агентствам. Он доступен бесплатно по адресу drymonitor.unl.edu.
Группы
Размер пикселя 250 метров
Группы
Имя
Мин.
Макс
Размер пикселя
Описание
DM
0
4
метров
Классы засухи
Условия эксплуатации
Работа лицензирована по лицензии Open Data для использования. U.S. Drought Monitor совместно разрабатывается Национальным центром по смягчению последствий засухи при Университете Небраски в Линкольне, Министерством сельского хозяйства США и Национальным управлением океанических и атмосферных исследований. Карта предоставлена NDMC.
Цитаты
Цитаты:
Национальный центр по смягчению последствий засухи; Министерство сельского хозяйства США; Национальное управление океанических и атмосферных исследований (2023). Монитор засухи в США. Университет Небраски в Линкольне. https://droughtmonitor.unl.edu/. Дата обращения: 17 сентября 2023 г.
Монитор засухи в США — это карта, публикуемая каждый четверг, на которой показаны районы США, охваченные засухой. На карте используются пять категорий: аномально засушливый (D0), показывающий районы, которые могут начать или выйти из засухи, и четыре уровня засухи: умеренный (D1), сильный (D2), экстремальный…
[null,null,[],[[["\u003cp\u003eThe U.S. Drought Monitor dataset provides weekly maps of drought conditions across the United States, categorized into five levels: abnormally dry (D0) and moderate (D1) to exceptional (D4) drought.\u003c/p\u003e\n"],["\u003cp\u003eThis dataset is freely available and jointly produced by the National Drought Mitigation Center, NOAA, and USDA, covering the period from 2000 to 2024.\u003c/p\u003e\n"],["\u003cp\u003eDrought classifications are provided at a 250-meter resolution and can be easily accessed and analyzed within Google Earth Engine.\u003c/p\u003e\n"],["\u003cp\u003eThe dataset is licensed under an Open data license for use and is part of the Awesome GEE Community Catalog.\u003c/p\u003e\n"],["\u003cp\u003eUsers can explore and visualize the data using the provided Earth Engine snippet and code editor example for a detailed analysis of drought patterns.\u003c/p\u003e\n"]]],["The U.S. Drought Monitor, jointly produced by the NDMC, NOAA, and USDA, releases a weekly map indicating drought conditions across the U.S. It uses five classifications: abnormally dry (D0), moderate (D1), severe (D2), extreme (D3), and exceptional (D4). Data, available from 2000 to 2025, is provided by the National Drought Mitigation Center and accessible through the Google Earth Engine platform, using the code `ee.ImageCollection(\"projects/sat-io/open-datasets/us-drought-monitor\")`. Each category is represented by a color.\n"],null,["info\n\n\nThis dataset is part of a Community Catalog, and not managed by Google Earth Engine.\n\nContact gee-community-catalog@googlegroups.com\n\nfor bugs or [view more datasets](https://developers.google.com/earth-engine/datasets/community/sat-io)\nfrom the Awesome GEE Community Catalog Catalog. [Learn more about Community datasets](/earth-engine/datasets/community). \n[](https://gee-community-catalog.org/) \n\nCatalog Owner\n: Awesome GEE Community Catalog\n\nDataset Availability\n: 2000-01-04T00:00:00Z--2025-08-19T00:00:00Z\n\nDataset Provider\n:\n\n\n [National Drought Mitigation Center](https://drought.unl.edu/)\n\nTags\n:\n [community-dataset](/earth-engine/datasets/tags/community-dataset) [drought](/earth-engine/datasets/tags/drought) [noaa](/earth-engine/datasets/tags/noaa) [precipitation](/earth-engine/datasets/tags/precipitation) [sat-io](/earth-engine/datasets/tags/sat-io) [usda](/earth-engine/datasets/tags/usda) \nndmc \n\nDescription \nThe U.S. Drought Monitor is a map released every Thursday, showing parts of the U.S. that are in drought. The map uses five classifications: abnormally dry (D0), showing areas that may be going into or are coming out of drought, and four levels of drought: moderate (D1), severe (D2), extreme (D3) and exceptional (D4). The Drought Monitor has been a team effort since its inception in 1999, produced jointly by the National Drought Mitigation Center (NDMC) at the University of Nebraska-Lincoln, the National Oceanic and Atmospheric Administration (NOAA), and the U.S. Department of Agriculture (USDA). The NDMC hosts the web site of the drought monitor and the associated data, and provides the map and data to NOAA, USDA and other agencies. It is freely available at droughtmonitor.unl.edu.\n\nBands\n\n\n**Pixel Size**\n\n250 meters\n\n**Bands**\n\n| Name | Min | Max | Pixel Size | Description |\n|------|-----|-----|------------|-----------------|\n| `DM` | 0 | 4 | meters | Drought classes |\n\nTerms of Use\n\n**Terms of Use**\n\nThe work is licensed under an Open data license for use. The U.S. Drought Monitor is jointly produced by the National Drought Mitigation Center\nat the University of Nebraska-Lincoln, the United States Department of Agriculture and the National Oceanic and Atmospheric Administration. Map courtesy of NDMC.\n\nCitations \nCitations:\n\n- National Drought Mitigation Center; U.S. Department of Agriculture; National Oceanic and Atmospheric Administration (2023). United States Drought Monitor. University of Nebraska-Lincoln. https://droughtmonitor.unl.edu/. Accessed 2023-09-17\n\nExplore with Earth Engine **Important:** Earth Engine is a platform for petabyte-scale scientific analysis and visualization of geospatial datasets, both for public benefit and for business and government users. Earth Engine is free to use for research, education, and nonprofit use. To get started, please [register for Earth Engine access.](https://console.cloud.google.com/earth-engine)\n\nCode Editor (JavaScript) \n\n```javascript\nvar usdm = ee.ImageCollection(\n \"projects/sat-io/open-datasets/us-drought-monitor\"\n);\n/*\nCategory\tDescription\nDO\tAbnormally Dry\nD1\tModerate Drought\nD2\tSevere Drought\nD3\tExtreme Drought\nD4\tExceptional Drought\n*/\n\nvar usdm = ee.Image(usdm.toList(usdm.size()).get(-1));\n\n// Define a dictionary which will be used to make legend and visualize image on map\nvar dict = {\n names: [\n \"DO\tAbnormally Dry\", //1\n \"D1 Moderate Drought\", //2\n \"D2 Severe Drought\", //3\n \"D3 Extreme Drought\", //4\n \"D4 Exceptional Drought\", //5\n ],\n colors: [\"FFFF00\", \"FCD37F\", \"FFAA00\", \"E60000\", \"730000\"],\n};\n\n// Create a panel to hold the legend widget\nvar legend = ui.Panel({\n style: {\n position: \"bottom-left\",\n padding: \"8px 15px\",\n },\n});\n\n// Function to generate the legend\nfunction addCategoricalLegend(panel, dict, title) {\n // Create and add the legend title.\n var legendTitle = ui.Label({\n value: title,\n style: {\n fontWeight: \"bold\",\n fontSize: \"18px\",\n margin: \"0 0 4px 0\",\n padding: \"0\",\n },\n });\n panel.add(legendTitle);\n\n var loading = ui.Label(\"Loading legend...\", { margin: \"2px 0 4px 0\" });\n panel.add(loading);\n\n // Creates and styles 1 row of the legend.\n var makeRow = function (color, name) {\n // Create the label that is actually the colored box.\n var colorBox = ui.Label({\n style: {\n backgroundColor: color,\n // Use padding to give the box height and width.\n padding: \"8px\",\n margin: \"0 0 4px 0\",\n },\n });\n\n // Create the label filled with the description text.\n var description = ui.Label({\n value: name,\n style: { margin: \"0 0 4px 6px\" },\n });\n\n return ui.Panel({\n widgets: [colorBox, description],\n layout: ui.Panel.Layout.Flow(\"horizontal\"),\n });\n };\n\n // Get the list of palette colors and class names from the image.\n var palette = dict[\"colors\"];\n var names = dict[\"names\"];\n loading.style().set(\"shown\", false);\n\n for (var i = 0; i \u003c names.length; i++) {\n panel.add(makeRow(palette[i], names[i]));\n }\n\n Map.add(panel);\n}\n\n/*\n // Display map and legend ///////////////////////////////////////////////////////////////////////////////\n*/\n\n// Add the legend to the map\naddCategoricalLegend(legend, dict, \"US Drought Monitor\");\n\n// Add USDM Image image to the map\nMap.addLayer(\n usdm,\n { min: 0, max: 4, palette: dict[\"colors\"] },\n usdm.get(\"system:index\").getInfo()\n);\n```\n[Open in Code Editor](https://code.earthengine.google.com/?scriptPath=Examples:Datasets/sat-io/projects_sat-io_open-datasets_us-drought-monitor) \n[United States Drought Monitor](/earth-engine/datasets/catalog/projects_sat-io_open-datasets_us-drought-monitor) \nThe U.S. Drought Monitor is a map released every Thursday, showing parts of the U.S. that are in drought. The map uses five classifications: abnormally dry (D0), showing areas that may be going into or are coming out of drought, and four levels of drought: moderate (D1), severe (D2), extreme ... \nprojects/sat-io/open-datasets/us-drought-monitor, community-dataset,drought,noaa,precipitation,sat-io,usda \n2000-01-04T00:00:00Z/2025-08-19T00:00:00Z \n-90 -180 90 180 \nGoogle Earth Engine \nhttps://developers.google.com/earth-engine/datasets\n\n- [](https://doi.org/https://drought.unl.edu/)\n- [](https://doi.org/https://developers.google.com/earth-engine/datasets/catalog/projects_sat-io_open-datasets_us-drought-monitor)"]]