
「帳單」報表頁面是 Google Cloud 控制台的報表功能。這項工具可自訂分析您過去和目前的 Google Maps Platform 與 Google Cloud 支出,並提供必要工具,協助您瞭解費用和對帳。
Cloud Billing 報表可協助您解答下列問題:
- 與上個月相比,我這個月的支出如何?
- 哪個 Google 地圖服務的支出最多?
- 特定地區的支出是多少?
- 承諾使用折扣為我節省多少費用?我還能省下更多費用嗎?
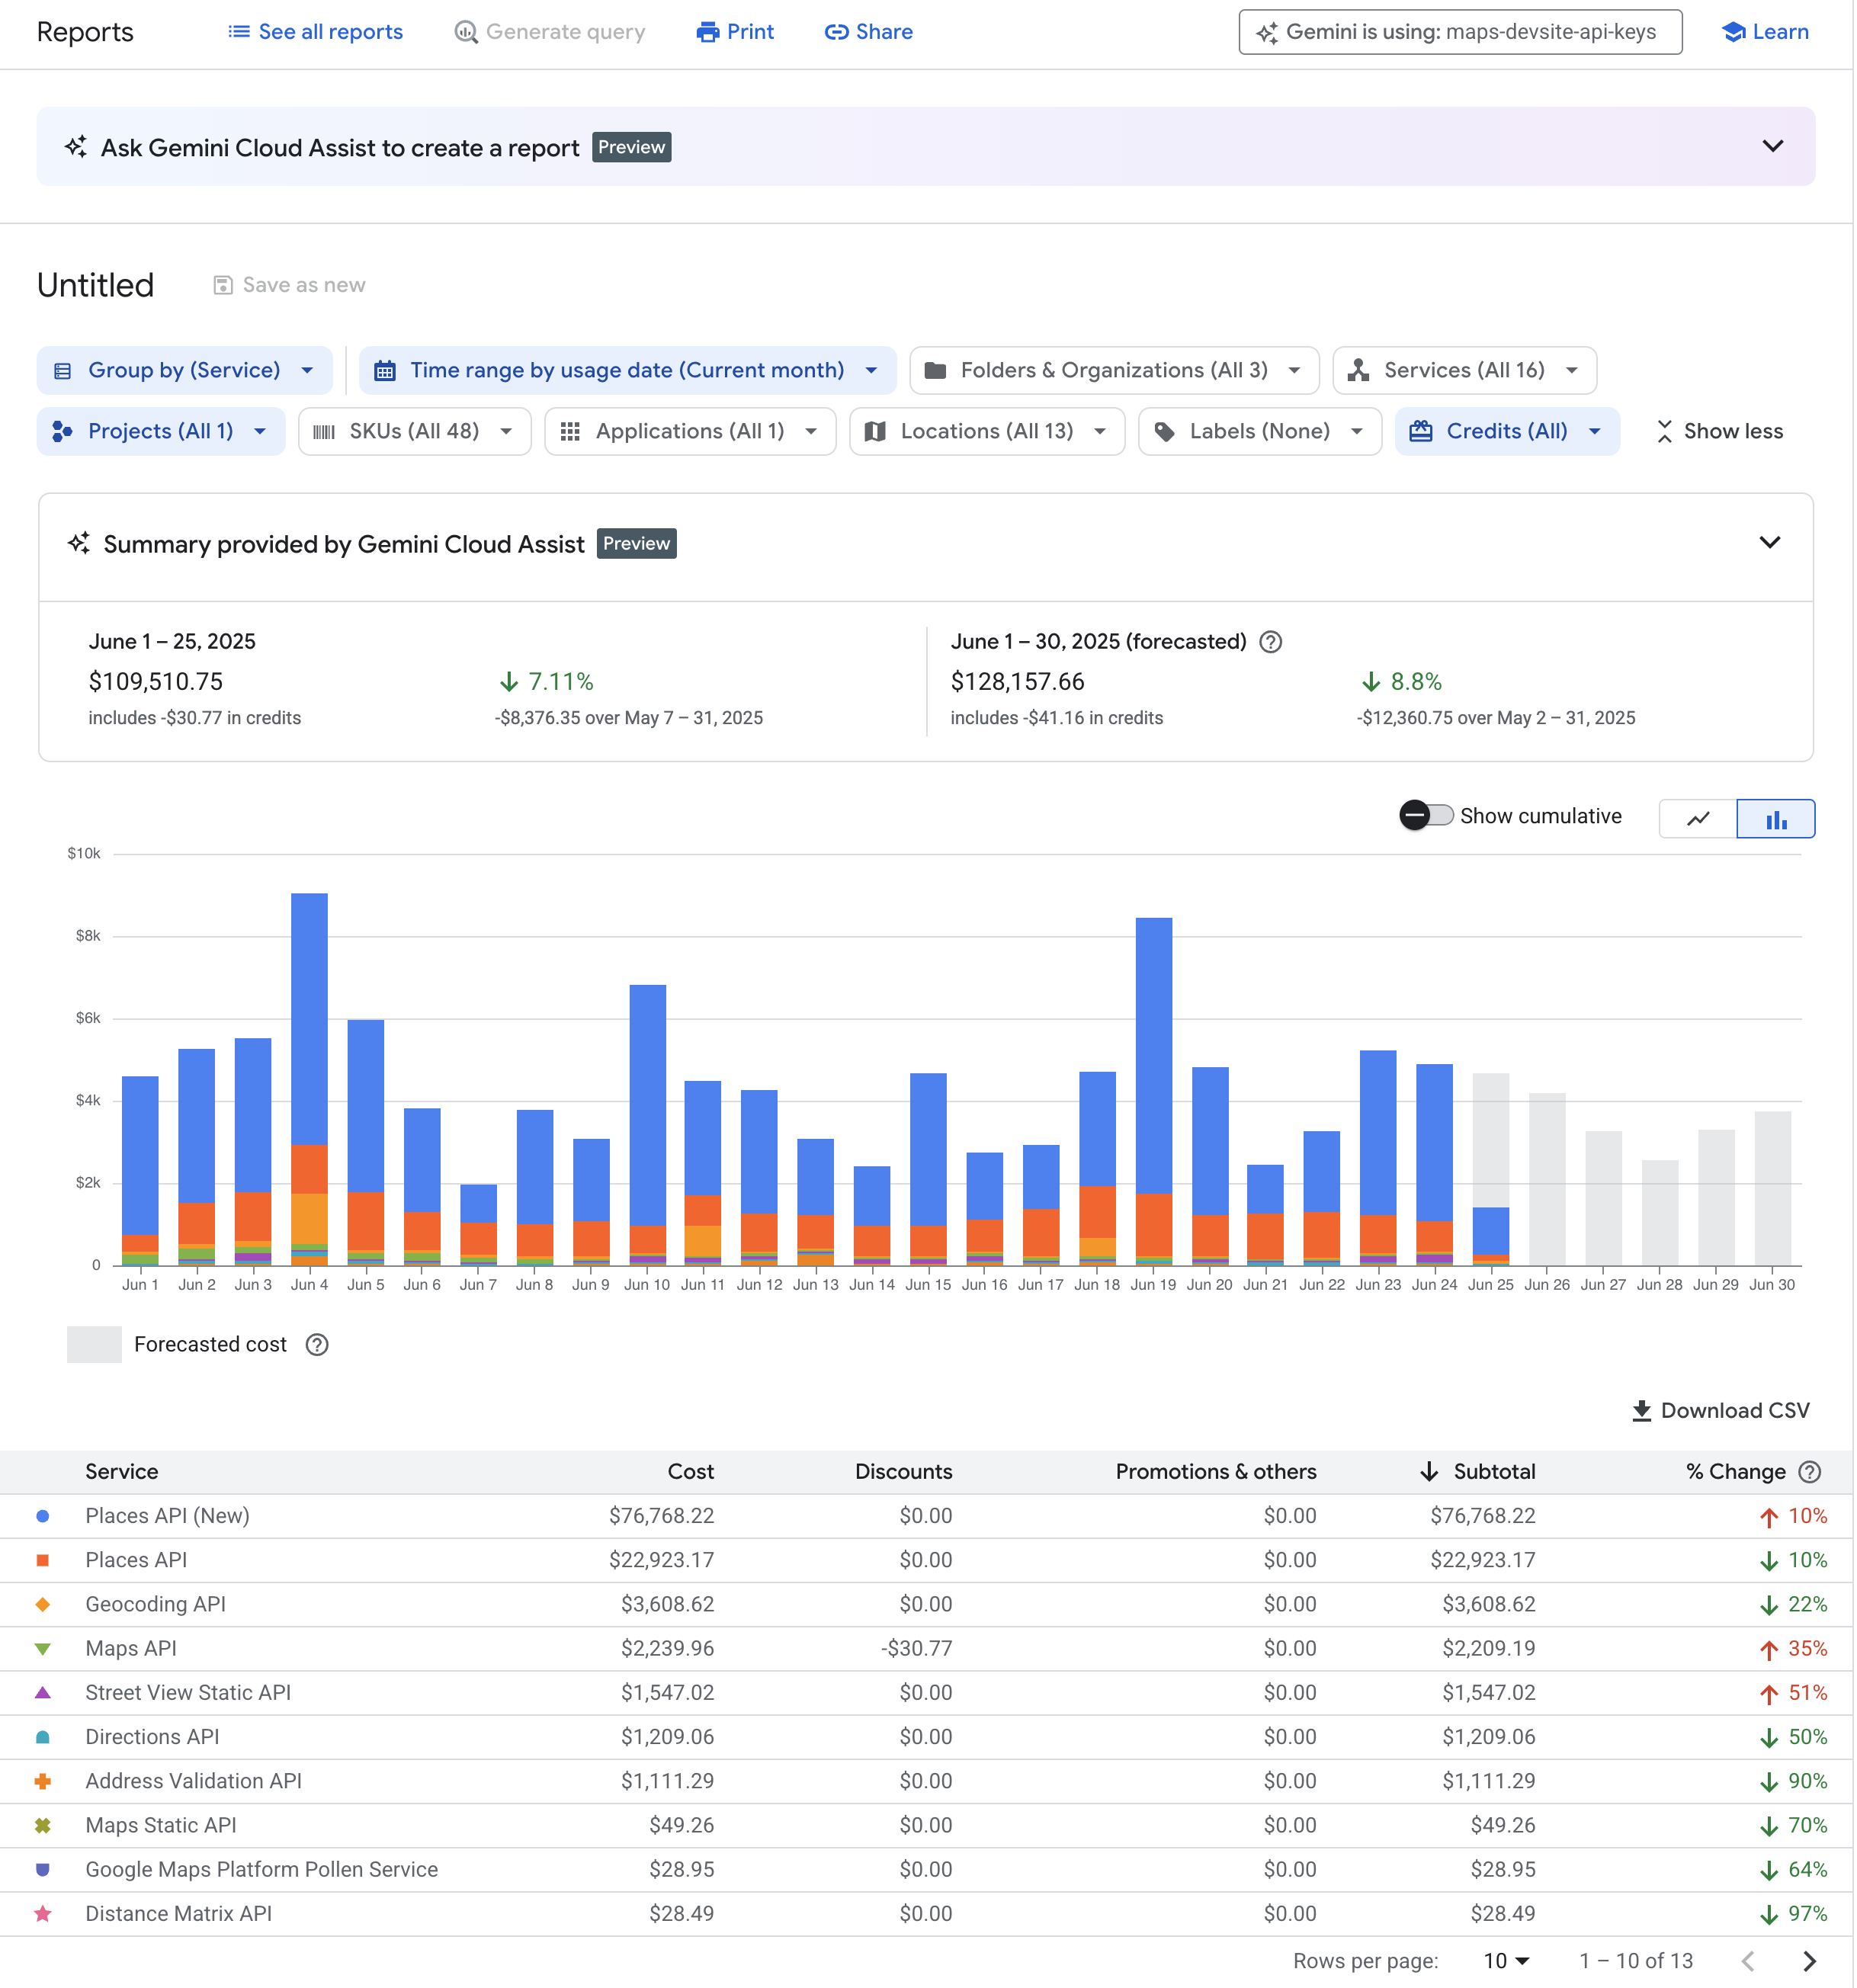
下圖顯示帳單報表頁面。
如要透過互動式導覽瞭解控制台的「帳單報表」頁面,請啟動帳單報表導覽。
查看帳單報表
預先定義報表
Google Cloud 控制台提供多種預先定義的報表。這些預先定義的報表適用於多數用途,而且可以擴充及自訂,提供更精細的報表資料。
Google Cloud 控制台提供下列報表:
帳單報表
您可以使用帳單報表,透過多種可自訂的設定和篩選器,查看及分析用量費用。
在每日報表中,雲端帳單報表的 24 小時時間範圍是從美國和加拿大太平洋時間 (UTC-8) 的午夜開始計算。並會隨美國日光節約時間進行調整。
費用表報表
月結單和對帳單費用分析
費用表報表提供詳細的月結單和對帳單資訊。包括專案層級費用明細、每個專案的稅金費用,以及服務 ID、SKU ID 和專案編號等詳細資料。這份報表可自訂,並可下載為 CSV 檔案。
費用明細報表
每月費用和節省金額總覽
費用明細報表會顯示每月費用和抵免額的摘要,包括:
- Google Cloud 隨選用量費用 (以未折扣的定價計算)。
- 按照自訂合約價格計算的折扣。
- 依用量計算的點數節省金額 (例如承諾使用、續用、免費層級)。
- 月結單層級費用,例如稅金和調整項。
價格報表
Google Cloud 控制台服務定價
價目表報表會提供 Google Cloud、Google 地圖平台和 Google Workspace 的 SKU 價格,並顯示檢視當日的最新價格。
這份報表會顯示:
- Cloud Billing 帳戶專屬的 SKU 價格。
- 適用於採用自訂價格的帳戶,顯示定價、合約價格和有效折扣。
- 如果 SKU 適用分級定價,每個價格級別會列在不同的資料列中。
- 所有價格均以帳單帳戶的幣別計算。
您可以自訂報表,並下載為 CSV 檔案進行離線分析。
承諾使用折扣 (CUD) 分析報表
瞭解折扣
只要購買承諾使用合約,並承諾在一年或三年的合約期間內,達到一定的資源用量或支出金額,即可享有符合資格的 Google Cloud 資源折扣價。
CUD 分析報表可以圖表呈現,並協助您瞭解所購買 CUD 的成效和財務影響。
這些報表可解答與下列主題相關的重要問題:
- CUD 節省的帳單費用。
- 充分利用現有承諾。
- 承諾使用合約涵蓋的合格用量。
- 增加使用承諾可進一步節省費用。
- 透過分享折扣提高使用率。
如需可用報表的完整清單,請參閱「Cloud Billing 報表」。
自訂報表
您可以使用 BigQuery,根據匯出的帳單資料設定自訂報表。如要這麼做,您必須啟用「將 Cloud Billing 資料匯出至 BigQuery」服務,系統會自動將資料上傳至 BigQuery 資料集。
資料匯入 BigQuery 後,您就能對資料執行查詢,或使用 Looker Studio 等工具建立自訂視覺化效果。