ภาพรวมการ์ด 2 มิติ
จัดทุกอย่างให้เป็นระเบียบอยู่เสมอด้วยคอลเล็กชัน
บันทึกและจัดหมวดหมู่เนื้อหาตามค่ากำหนดของคุณ
นักพัฒนาแอปในเขตเศรษฐกิจยุโรป (EEA)
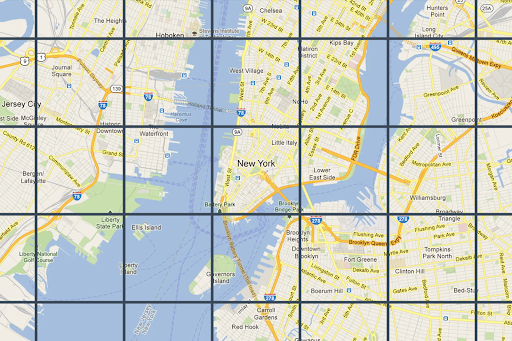 ไทล์แผนที่เป็นเพียงการแบ่งโลกออกเป็นตารางกริดที่จัดทำดัชนี
ไว้ ซึ่งช่วยให้คุณเข้าถึงและใช้ข้อมูลแผนที่ได้อย่างมีประสิทธิภาพและแบบไดนามิก
ในมาตราส่วนแผนที่หลายระดับ Map Tiles API ช่วยให้คุณเข้าถึง
ชุดข้อมูลเชิงพื้นที่แบบธีมหลายชุด ซึ่งรวมถึงชุดข้อมูลที่ Google คัดสรรแล้ว ดังนี้
ไทล์แผนที่เป็นเพียงการแบ่งโลกออกเป็นตารางกริดที่จัดทำดัชนี
ไว้ ซึ่งช่วยให้คุณเข้าถึงและใช้ข้อมูลแผนที่ได้อย่างมีประสิทธิภาพและแบบไดนามิก
ในมาตราส่วนแผนที่หลายระดับ Map Tiles API ช่วยให้คุณเข้าถึง
ชุดข้อมูลเชิงพื้นที่แบบธีมหลายชุด ซึ่งรวมถึงชุดข้อมูลที่ Google คัดสรรแล้ว ดังนี้
ไทล์รูปภาพแผนที่ถนนที่อิงตามข้อมูลภูมิประเทศแบบเวกเตอร์ที่มีการจัดรูปแบบแผนที่ของ Google
ภาพถ่ายออร์โธที่ถ่ายโดยกล้องทั้งจากดาวเทียมและกล้องที่ติดตั้งบนอากาศยาน ซึ่งให้ภาพจากมุมสูง (จุดเหนือศีรษะ) ของโลก
แผนที่เส้นชั้นความสูงแบบแรเงา
Map Tiles แบบ 2 มิติทั้งหมดจะมีการอ้างอิงทางภูมิศาสตร์และจัดแนวให้ตรงกัน โดยระบบจะเลือก
ตามขอบเขตทางภูมิศาสตร์ของวิวพอร์ตและระดับการซูม ระดับการซูม
มีตั้งแต่ 0 (ดูทั้งโลก) ถึง 22 (ดูถนนและ
บล็อก)
ธีมของแผนที่
คุณรับไทล์แผนที่สำหรับธีมแผนที่ต่อไปนี้ได้
| ธีมแผนที่ |
คำอธิบาย |
| แผนกลยุทธ์ |
ถนน อาคาร จุดที่น่าสนใจ และเขตแดนทางการเมือง |
| ดาวเทียม |
ภาพถ่ายจากอวกาศ |
| ภูมิประเทศ |
แผนที่เส้นชั้นความสูงที่แสดงลักษณะทางธรรมชาติ เช่น พืชพรรณ |
หากต้องการขอไทล์แผนที่จาก Map Tiles API คุณต้องขอโทเค็นเซสชันก่อน
โทเค็นเซสชัน
จะติดตามสถานะปัจจุบันของแผนที่และวิวพอร์ต เมื่อตั้งค่าโทเค็นเซสชัน คุณต้องตั้งค่า mapType ให้ตรงกับธีมแผนที่ที่ต้องการ
จากนั้นคุณต้องใส่โทเค็นเซสชันในคำขอแต่ละรายการไปยัง Map Tiles API
คำขอข้อมูลวิวพอร์ต
วิวพอร์ตกำหนดขนาดของกล่องที่จัดฉากโลก คำขอข้อมูล Viewport จะแสดงรายละเอียดเกี่ยวกับไทล์แผนที่ที่ประกอบกันเป็น
Viewport ปัจจุบัน เหตุผลที่คุณขอข้อมูล Viewport ก็คือเพื่อให้แน่ใจว่าคุณจะไม่ขอภาพที่ระดับการซูมที่ไม่มีอยู่
เช่น เมืองส่วนใหญ่มีภาพที่ระดับการซูม 22 แต่ไม่มีภาพของมหาสมุทรเนื่องจาก
จะแสดงเป็นสี่เหลี่ยมสีน้ำเงินที่ไม่มีลักษณะเด่น
คำขอขนาดวิวพอร์ตคือคำขอ HTTPS GET ในรูปแบบต่อไปนี้
curl "https://tile.googleapis.com/tile/v1/viewport?session=YOUR_SESSION_TOKEN&key=YOUR_API_KEY&zoom=zoom&north=north&south=south&east=east&west=west"
คำขอประกอบด้วยฟิลด์ต่อไปนี้
zoom- ระดับการซูมของวิวพอร์ต
north, south, east, west- จุดเหนือสุด ใต้สุด ตะวันออกสุด และตะวันตกสุดใน Viewport ซึ่งแสดงในหน่วย
องศา เหนือและใต้ต้องอยู่ในช่วง (-90,90) ตะวันออกและตะวันตกต้องอยู่ในช่วง (-180, 180) หากต้องการแสดงขอบเขตที่ข้ามเส้นเมริเดียนตะวันตก ค่าตะวันตกจะเป็นค่าบวก (เช่น 170) และค่าตะวันออกจะเป็นค่าลบ (เช่น -170) ต้องระบุพารามิเตอร์ทั้งหมด
การตอบกลับข้อมูลวิวพอร์ต
การตอบกลับของวิวพอร์ตจะบอกคุณว่าพื้นที่ใดมีภาพ และที่ระดับการซูมใด
การตอบกลับข้อมูลวิวพอร์ตมีรูปแบบดังนี้
{
  "copyright": "Map data ©2023",
  "maxZoomRects": [
    {
      "maxZoom": 19,
      "north": 90,
      "south": -90,
      "east": 180,
      "west": -180
    },
    {
      "maxZoom": 9,
      "north": 90,
      "south": -90,
      "east": 180,
      "west": -180
    },
    {
      "maxZoom": 14,
      "north": 84.375,
      "south": -84.375,
      "east": 180,
      "west": -180
    }, ...
  ]
}
เนื้อหาการตอบกลับจะมีช่องต่อไปนี้
copyright- มีสตริงการระบุแหล่งที่มาที่คุณต้องแสดงในแผนที่เมื่อแสดงไทล์แผนที่ถนนและไทล์ดาวเทียม
ดูข้อมูลเพิ่มเติมได้ที่นโยบาย Map Tiles API
maxZoomRect- มีอาร์เรย์ของสี่เหลี่ยมผืนผ้าล้อมรอบที่ทับซ้อนกับ
วิวพอร์ตปัจจุบัน นอกจากนี้ยังมีระดับการซูมสูงสุดที่ใช้ได้ภายในสี่เหลี่ยมผืนผ้าแต่ละรูป
ฟังก์ชันพิกัดแผนที่ย่อย
เครื่องมือ (ฟังก์ชันอย่างง่าย) มีให้บริการในภาษาโปรแกรมส่วนใหญ่เพื่อแปลง
จากคู่ละติจูด/ลองจิจูดเป็นพิกัดไทล์ที่ระดับการซูมที่เฉพาะเจาะจง
ลองดูตัวอย่างโค้ด JavaScript ต่อไปนี้ที่แปลงจาก a
latLng เป็นจุดก่อน แล้วจึงแปลงจากจุดเป็นพิกัดไทล์
var TILE_SIZE = 256;

function fromLatLngToPoint(latLng) {
  var mercator = -Math.log(Math.tan((0.25 + latLng.lat() / 360) * Math.PI));
  return {
    x: TILE_SIZE * (latLng.lng() / 360 + 0.5),
    y: TILE_SIZE / 2 * (1 +  mercator / Math.PI)
  };
}

function fromLatLngToTileCoord(latLng, zoom) {
  var point = fromLatLngToPoint(latLng);
  var scale = Math.pow(2, zoom);

  return {
    x: Math.floor(point.x * scale / TILE_SIZE),
    y: Math.floor(point.y * scale / TILE_SIZE),
    z: zoom
  };
}
เนื้อหาของหน้าเว็บนี้ได้รับอนุญาตภายใต้ใบอนุญาตที่ต้องระบุที่มาของครีเอทีฟคอมมอนส์ 4.0 และตัวอย่างโค้ดได้รับอนุญาตภายใต้ใบอนุญาต Apache 2.0 เว้นแต่จะระบุไว้เป็นอย่างอื่น โปรดดูรายละเอียดที่นโยบายเว็บไซต์ Google Developers Java เป็นเครื่องหมายการค้าจดทะเบียนของ Oracle และ/หรือบริษัทในเครือ
อัปเดตล่าสุด 2025-08-29 UTC
[null,null,["อัปเดตล่าสุด 2025-08-29 UTC"],[[["\u003cp\u003eMap Tiles API allows access to various thematic geodatasets like roadmap, orthophotography, and hillshade, dividing the world into an indexed grid for efficient data utilization.\u003c/p\u003e\n"],["\u003cp\u003eMap tiles are available in roadmap, satellite, and terrain themes, and can be overlaid for richer visualizations.\u003c/p\u003e\n"],["\u003cp\u003eA session token is required for accessing Map Tiles API, which tracks the map state and desired theme.\u003c/p\u003e\n"],["\u003cp\u003eViewport information requests help determine available zoom levels and imagery for a specific area to avoid requesting non-existent data.\u003c/p\u003e\n"],["\u003cp\u003eTile coordinate functions can be used to convert latitude/longitude pairs into tile coordinates for specific zoom levels, enabling precise map tile retrieval.\u003c/p\u003e\n"]]],["Map Tiles API provides access to geodatasets, including roadmap, satellite, and terrain themes, divided into an indexed grid. Users request a session token and specify a map theme. Viewport information, obtained via HTTPS GET requests, determines the available imagery and zoom levels (0-22) within a defined area. Responses include copyright attribution and maximum zoom levels. Tile coordinate functions convert latitude/longitude to tile coordinates for specific zoom levels.\n"],null,["# 2D Tiles overview\n\n**European Economic Area (EEA) developers** If your billing address is in the European Economic Area, effective on 8 July 2025, the [Google\n| Maps Platform EEA Terms of Service](https://cloud.google.com/terms/maps-platform/eea) will apply to your use of the Services. [Learn more](/maps/comms/eea/faq). In addition, certain content from the Map Tiles API will no longer be returned. [Learn more](/maps/comms/eea/map-tiles).\n\nMap Tiles are simply the division of the world into an indexed\ngrid. It lets you access and utilize map data efficiently and dynamically\nat multiple cartographic scales. Map Tiles API gives you access to\nmultiple thematic geodatasets, including Google-curated:\n\n- Roadmap image tiles based on vector topographic data with Google's\n cartographic styling.\n\n- Orthophotography captured by both satellite and airborne cameras that deliver\n top down (nadir) imagery of the earth.\n\n- Hillshade contour maps.\n\n2D Map Tiles are all georeferenced and aligned to each other. They're selected\nbased on the geographic extent of the viewport and the zoom level. Zoom levels\nrange from zero (to view the world in its entirety) to 22 (to view streets and\nblocks).\n\nMap themes\n----------\n\nYou can get map tiles for the following map themes.\n\n| Map theme | Description |\n|-------------------------------------------------|----------------------------------------------------------------|\n| [Roadmap](/maps/documentation/tile/roadmap) | Roads, buildings, points of interest, and political boundaries |\n| [Satellite](/maps/documentation/tile/satellite) | Photographic imagery taken from space |\n| [Terrain](/maps/documentation/tile/terrain) | A contour map that shows natural features such as vegetation |\n\n| **Note:** Map tiles can consist of one or more layers. For example, a roadmap layer can be overlaid on top of a satellite map theme. For more information, see [Optional fields](/maps/documentation/tile/session_tokens#optional_fields).\n\nTo request map tiles from Map Tiles API, you must first request a\n[session token](/maps/documentation/tile/session_tokens). The session token\ntracks the current state of your map and viewport. When you set up your session\ntoken, you must set the `mapType` value to match the map theme that you want.\nThen, you must include the session token in each of your requests to\nMap Tiles API.\n\nViewport information requests\n-----------------------------\n\nThe viewport defines the size of the box that frames the world scene. Viewport\ninformation requests return details about the map tiles that make up your\ncurrent viewport. The reason that you request viewport information is to ensure\nthat you avoid requesting imagery at zoom levels that don't exist.\n\nFor example, most cities have imagery at zoom level 22, but not the ocean since\nit would just end up displaying featureless blue squares.\n| **Note:** Included in the response is the attribution that you must display with your map, and the maximum zoom level---so you can build a zoom slider. For more information, see the [Map Tiles API Policies](/maps/documentation/tile/policies#map-tiles-api).\n\nThe viewport request is an HTTPS GET request in the following form. \n\n```json\ncurl \"https://tile.googleapis.com/tile/v1/viewport?session=\u003cvar class=\"apiparam\" translate=\"no\"\u003eYOUR_SESSION_TOKEN\u003c/var\u003e&key=YOUR_API_KEY&zoom=\u003cvar class=\"apiparam\" translate=\"no\"\u003ezoom\u003c/var\u003e&north=\u003cvar class=\"apiparam\" translate=\"no\"\u003enorth\u003c/var\u003e&south=\u003cvar class=\"apiparam\" translate=\"no\"\u003esouth\u003c/var\u003e&east=\u003cvar class=\"apiparam\" translate=\"no\"\u003eeast\u003c/var\u003e&west=\u003cvar class=\"apiparam\" translate=\"no\"\u003ewest\u003c/var\u003e\"\n```\n\nThe request contains the following fields:\n\n`zoom`\n: The zoom level of the viewport.\n\n`north`, `south`, `east`, `west`\n: The furthest north, south, east, and west points in the viewport, expressed in\n degrees. North and south must be in the range (-90,90), east and west must be in\n the range (-180, 180). To express bounds crossing the antimeridian, west can be\n positive (for example, 170) and east can be negative (for example, -170). All\n parameters are required.\n\nViewport information responses\n------------------------------\n\nThe viewport response tells you which areas have imagery, and at which zoom\nlevels. A viewport information response has the following form. \n\n {\n \"copyright\": \"Map data ©2023\",\n \"maxZoomRects\": [\n {\n \"maxZoom\": 19,\n \"north\": 90,\n \"south\": -90,\n \"east\": 180,\n \"west\": -180\n },\n {\n \"maxZoom\": 9,\n \"north\": 90,\n \"south\": -90,\n \"east\": 180,\n \"west\": -180\n },\n {\n \"maxZoom\": 14,\n \"north\": 84.375,\n \"south\": -84.375,\n \"east\": 180,\n \"west\": -180\n }, ...\n ]\n }\n\n| **Note:** In this example, the `maxZoomRects` array contains more objects than is shown.\n\nThe response body contains the following fields.\n\n`copyright`\n: Contains an attribution string that you must display on your map when you\n display roadmap and satellite tiles. For more information, see the\n [Map Tiles API Policies](/maps/documentation/tile/policies#map-tiles-api).\n\n`maxZoomRect`\n: Contains an array of bounding rectangles that overlap with the current\n viewport. Also contains the maximum zoom level available within each rectangle.\n\nTile coordinate functions\n-------------------------\n\nTools (simple functions) are available in most programming languages to convert\nfrom latitude/longitude pairs to tile coordinates at a specific zoom level.\nConsider the following JavaScript code example that first converts from a\n`latLng` to a point, and then from a point to tile coordinates. \n\n var TILE_SIZE = 256;\n\n function fromLatLngToPoint(latLng) {\n var mercator = -Math.log(Math.tan((0.25 + latLng.lat() / 360) * Math.PI));\n return {\n x: TILE_SIZE * (latLng.lng() / 360 + 0.5),\n y: TILE_SIZE / 2 * (1 + mercator / Math.PI)\n };\n }\n\n function fromLatLngToTileCoord(latLng, zoom) {\n var point = fromLatLngToPoint(latLng);\n var scale = Math.pow(2, zoom);\n\n return {\n x: Math.floor(point.x * scale / TILE_SIZE),\n y: Math.floor(point.y * scale / TILE_SIZE),\n z: zoom\n };\n }"]]