2D 資訊方塊總覽
透過集合功能整理內容
你可以依據偏好儲存及分類內容。
地圖圖塊只是將世界劃分為索引網格。讓您以多種製圖比例尺,有效率地動態存取及運用地圖資料。Map Tiles API 可讓您存取多個主題式地理資料集,包括 Google 策劃的資料集:
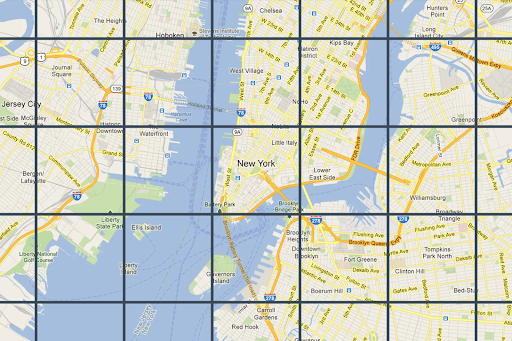
2D 地圖圖塊皆經過地理參照,且彼此對齊。系統會根據可視區域的地理範圍和縮放比例選取地圖。縮放等級從 0 (查看整個世界) 到 22 (查看街道和街區)。
地圖主題
您可以取得下列地圖主題的地圖圖塊。
地圖主題 |
說明 |
發展藍圖 |
道路、建築物、搜尋點和政治界線 |
衛星 |
從太空拍攝的攝影圖像 |
地形 |
顯示植被等自然地貌的等高線圖 |
如要從 Map Tiles API 要求地圖圖塊,請先要求工作階段權杖。工作階段權杖會追蹤地圖和可視區域的目前狀態。設定工作階段權杖時,請務必將 mapType
值設為所需的地圖主題。然後,您必須在每個 Map Tiles API 要求中加入會期權杖。
可視區域資訊要求
可視區域會定義世界場景的框架方塊大小。可視區域資訊要求會傳回組成目前可視區域的地圖圖塊詳細資料。您要求視埠資訊的原因是為了確保避免在不存在的縮放層級要求圖像。
舉例來說,大多數城市都有縮放等級 22 的圖像,但海洋沒有,因為海洋只會顯示沒有特徵的藍色方塊。
視埠要求是採用下列格式的 HTTPS GET 要求。
curl "https://tile.googleapis.com/tile/v1/viewport?session=YOUR_SESSION_TOKEN&key=YOUR_API_KEY&zoom=zoom&north=north&south=south&east=east&west=west"
要求包含下列欄位:
zoom
- 可視區域的縮放比例。
north
、south
、east
、west
- 視埠中最北、最南、最東和最西的點,以度數表示。北緯和南緯必須介於 (-90,90) 之間,東經和西經必須介於 (-180, 180) 之間。如要表示跨越反子午線的界線,西邊可為正值 (例如 170),東邊可為負值 (例如 -170)。所有參數皆為必填。
可視區域資訊回應
可視區域回應會指出哪些區域有圖像,以及圖像的縮放層級。視埠資訊回應的格式如下。
{
"copyright": "Map data ©2023",
"maxZoomRects": [
{
"maxZoom": 19,
"north": 90,
"south": -90,
"east": 180,
"west": -180
},
{
"maxZoom": 9,
"north": 90,
"south": -90,
"east": 180,
"west": -180
},
{
"maxZoom": 14,
"north": 84.375,
"south": -84.375,
"east": 180,
"west": -180
}, ...
]
}
回應內容包含下列欄位。
copyright
- 包含作者資訊字串,您在顯示道路地圖和衛星圖塊時,必須在地圖上顯示這項資訊。詳情請參閱「Map Tiles API 政策」。
maxZoomRect
- 包含與目前檢視區塊重疊的定界矩形陣列。也包含每個矩形內可用的最大縮放比例。
圖塊座標函式
大多數程式設計語言都提供工具 (簡單函式),可將經緯度配對轉換為特定縮放等級的圖塊座標。請參考下列 JavaScript 程式碼範例,該程式碼會先將 latLng
轉換為點,然後再將點轉換為圖塊座標。
var TILE_SIZE = 256;
function fromLatLngToPoint(latLng) {
var mercator = -Math.log(Math.tan((0.25 + latLng.lat() / 360) * Math.PI));
return {
x: TILE_SIZE * (latLng.lng() / 360 + 0.5),
y: TILE_SIZE / 2 * (1 + mercator / Math.PI)
};
}
function fromLatLngToTileCoord(latLng, zoom) {
var point = fromLatLngToPoint(latLng);
var scale = Math.pow(2, zoom);
return {
x: Math.floor(point.x * scale / TILE_SIZE),
y: Math.floor(point.y * scale / TILE_SIZE),
z: zoom
};
}
除非另有註明,否則本頁面中的內容是採用創用 CC 姓名標示 4.0 授權,程式碼範例則為阿帕契 2.0 授權。詳情請參閱《Google Developers 網站政策》。Java 是 Oracle 和/或其關聯企業的註冊商標。
上次更新時間:2025-08-29 (世界標準時間)。
[null,null,["上次更新時間:2025-08-29 (世界標準時間)。"],[[["\u003cp\u003eMap Tiles API allows access to various thematic geodatasets like roadmap, orthophotography, and hillshade, dividing the world into an indexed grid for efficient data utilization.\u003c/p\u003e\n"],["\u003cp\u003eMap tiles are available in roadmap, satellite, and terrain themes, and can be overlaid for richer visualizations.\u003c/p\u003e\n"],["\u003cp\u003eA session token is required for accessing Map Tiles API, which tracks the map state and desired theme.\u003c/p\u003e\n"],["\u003cp\u003eViewport information requests help determine available zoom levels and imagery for a specific area to avoid requesting non-existent data.\u003c/p\u003e\n"],["\u003cp\u003eTile coordinate functions can be used to convert latitude/longitude pairs into tile coordinates for specific zoom levels, enabling precise map tile retrieval.\u003c/p\u003e\n"]]],["Map Tiles API provides access to geodatasets, including roadmap, satellite, and terrain themes, divided into an indexed grid. Users request a session token and specify a map theme. Viewport information, obtained via HTTPS GET requests, determines the available imagery and zoom levels (0-22) within a defined area. Responses include copyright attribution and maximum zoom levels. Tile coordinate functions convert latitude/longitude to tile coordinates for specific zoom levels.\n"],null,["# 2D Tiles overview\n\n**European Economic Area (EEA) developers** If your billing address is in the European Economic Area, effective on 8 July 2025, the [Google\n| Maps Platform EEA Terms of Service](https://cloud.google.com/terms/maps-platform/eea) will apply to your use of the Services. [Learn more](/maps/comms/eea/faq). In addition, certain content from the Map Tiles API will no longer be returned. [Learn more](/maps/comms/eea/map-tiles).\n\nMap Tiles are simply the division of the world into an indexed\ngrid. It lets you access and utilize map data efficiently and dynamically\nat multiple cartographic scales. Map Tiles API gives you access to\nmultiple thematic geodatasets, including Google-curated:\n\n- Roadmap image tiles based on vector topographic data with Google's\n cartographic styling.\n\n- Orthophotography captured by both satellite and airborne cameras that deliver\n top down (nadir) imagery of the earth.\n\n- Hillshade contour maps.\n\n2D Map Tiles are all georeferenced and aligned to each other. They're selected\nbased on the geographic extent of the viewport and the zoom level. Zoom levels\nrange from zero (to view the world in its entirety) to 22 (to view streets and\nblocks).\n\nMap themes\n----------\n\nYou can get map tiles for the following map themes.\n\n| Map theme | Description |\n|-------------------------------------------------|----------------------------------------------------------------|\n| [Roadmap](/maps/documentation/tile/roadmap) | Roads, buildings, points of interest, and political boundaries |\n| [Satellite](/maps/documentation/tile/satellite) | Photographic imagery taken from space |\n| [Terrain](/maps/documentation/tile/terrain) | A contour map that shows natural features such as vegetation |\n\n| **Note:** Map tiles can consist of one or more layers. For example, a roadmap layer can be overlaid on top of a satellite map theme. For more information, see [Optional fields](/maps/documentation/tile/session_tokens#optional_fields).\n\nTo request map tiles from Map Tiles API, you must first request a\n[session token](/maps/documentation/tile/session_tokens). The session token\ntracks the current state of your map and viewport. When you set up your session\ntoken, you must set the `mapType` value to match the map theme that you want.\nThen, you must include the session token in each of your requests to\nMap Tiles API.\n\nViewport information requests\n-----------------------------\n\nThe viewport defines the size of the box that frames the world scene. Viewport\ninformation requests return details about the map tiles that make up your\ncurrent viewport. The reason that you request viewport information is to ensure\nthat you avoid requesting imagery at zoom levels that don't exist.\n\nFor example, most cities have imagery at zoom level 22, but not the ocean since\nit would just end up displaying featureless blue squares.\n| **Note:** Included in the response is the attribution that you must display with your map, and the maximum zoom level---so you can build a zoom slider. For more information, see the [Map Tiles API Policies](/maps/documentation/tile/policies#map-tiles-api).\n\nThe viewport request is an HTTPS GET request in the following form. \n\n```json\ncurl \"https://tile.googleapis.com/tile/v1/viewport?session=\u003cvar class=\"apiparam\" translate=\"no\"\u003eYOUR_SESSION_TOKEN\u003c/var\u003e&key=YOUR_API_KEY&zoom=\u003cvar class=\"apiparam\" translate=\"no\"\u003ezoom\u003c/var\u003e&north=\u003cvar class=\"apiparam\" translate=\"no\"\u003enorth\u003c/var\u003e&south=\u003cvar class=\"apiparam\" translate=\"no\"\u003esouth\u003c/var\u003e&east=\u003cvar class=\"apiparam\" translate=\"no\"\u003eeast\u003c/var\u003e&west=\u003cvar class=\"apiparam\" translate=\"no\"\u003ewest\u003c/var\u003e\"\n```\n\nThe request contains the following fields:\n\n`zoom`\n: The zoom level of the viewport.\n\n`north`, `south`, `east`, `west`\n: The furthest north, south, east, and west points in the viewport, expressed in\n degrees. North and south must be in the range (-90,90), east and west must be in\n the range (-180, 180). To express bounds crossing the antimeridian, west can be\n positive (for example, 170) and east can be negative (for example, -170). All\n parameters are required.\n\nViewport information responses\n------------------------------\n\nThe viewport response tells you which areas have imagery, and at which zoom\nlevels. A viewport information response has the following form. \n\n {\n \"copyright\": \"Map data ©2023\",\n \"maxZoomRects\": [\n {\n \"maxZoom\": 19,\n \"north\": 90,\n \"south\": -90,\n \"east\": 180,\n \"west\": -180\n },\n {\n \"maxZoom\": 9,\n \"north\": 90,\n \"south\": -90,\n \"east\": 180,\n \"west\": -180\n },\n {\n \"maxZoom\": 14,\n \"north\": 84.375,\n \"south\": -84.375,\n \"east\": 180,\n \"west\": -180\n }, ...\n ]\n }\n\n| **Note:** In this example, the `maxZoomRects` array contains more objects than is shown.\n\nThe response body contains the following fields.\n\n`copyright`\n: Contains an attribution string that you must display on your map when you\n display roadmap and satellite tiles. For more information, see the\n [Map Tiles API Policies](/maps/documentation/tile/policies#map-tiles-api).\n\n`maxZoomRect`\n: Contains an array of bounding rectangles that overlap with the current\n viewport. Also contains the maximum zoom level available within each rectangle.\n\nTile coordinate functions\n-------------------------\n\nTools (simple functions) are available in most programming languages to convert\nfrom latitude/longitude pairs to tile coordinates at a specific zoom level.\nConsider the following JavaScript code example that first converts from a\n`latLng` to a point, and then from a point to tile coordinates. \n\n var TILE_SIZE = 256;\n\n function fromLatLngToPoint(latLng) {\n var mercator = -Math.log(Math.tan((0.25 + latLng.lat() / 360) * Math.PI));\n return {\n x: TILE_SIZE * (latLng.lng() / 360 + 0.5),\n y: TILE_SIZE / 2 * (1 + mercator / Math.PI)\n };\n }\n\n function fromLatLngToTileCoord(latLng, zoom) {\n var point = fromLatLngToPoint(latLng);\n var scale = Math.pow(2, zoom);\n\n return {\n x: Math.floor(point.x * scale / TILE_SIZE),\n y: Math.floor(point.y * scale / TILE_SIZE),\n z: zoom\n };\n }"]]