可通过多种方法来生成模型结果输出。您可以:
生成可自定义时间范围的双页 HTML 报告,并将该 HTML 输出导出到您的 Google 云端硬盘,以便与团队共享。
生成模型结果摘要,从而自定义自己的报告、可视化图表,或将这些内容导出为其他格式。通过这些媒体指标的数值摘要,您可以了解更多详细信息。
您还可以绘制媒体可视化图表。如需了解详情,请参阅绘制媒体可视化图表。
生成 HTML 模型结果报告
如需生成并导出模型结果报告,请执行以下操作:
如果您使用的是 Colab,并希望将报告导出到 Google 云端硬盘,请在您的 Colab 笔记本上装载 Google 云端硬盘:
from google.colab import drive
drive.mount('/content/drive')
使用 Meridian 模型对象初始化
Summarizer类:summarizer = summarizer.Summarizer(mmm)将文件名、路径、开始日期和结束日期传递给
output_model_results_summary,以针对相应时间段生成摘要并将其保存到指定的文件中。示例:
filepath = '/content/drive/MyDrive'
start_date = '2020-01-05'
end_date = '2020-12-27'
summarizer.output_model_results_summary(f'{FILENAME}.html',
                                        filepath,
                                        start_date,
                                        end_date)
其中:
filepath是要将该文件保存到的 Google 云端硬盘路径。start_date是报告的开始日期,格式为 yyyy-mm-dd。end_date是报告的结束日期,格式为 yyyy-mm-dd。FILENAME是您要为该文件指定的名称,例如summary_output.html。文件扩展名必须为 HTML。
系统会生成 HTML 报告并将其保存到指定的文件位置。
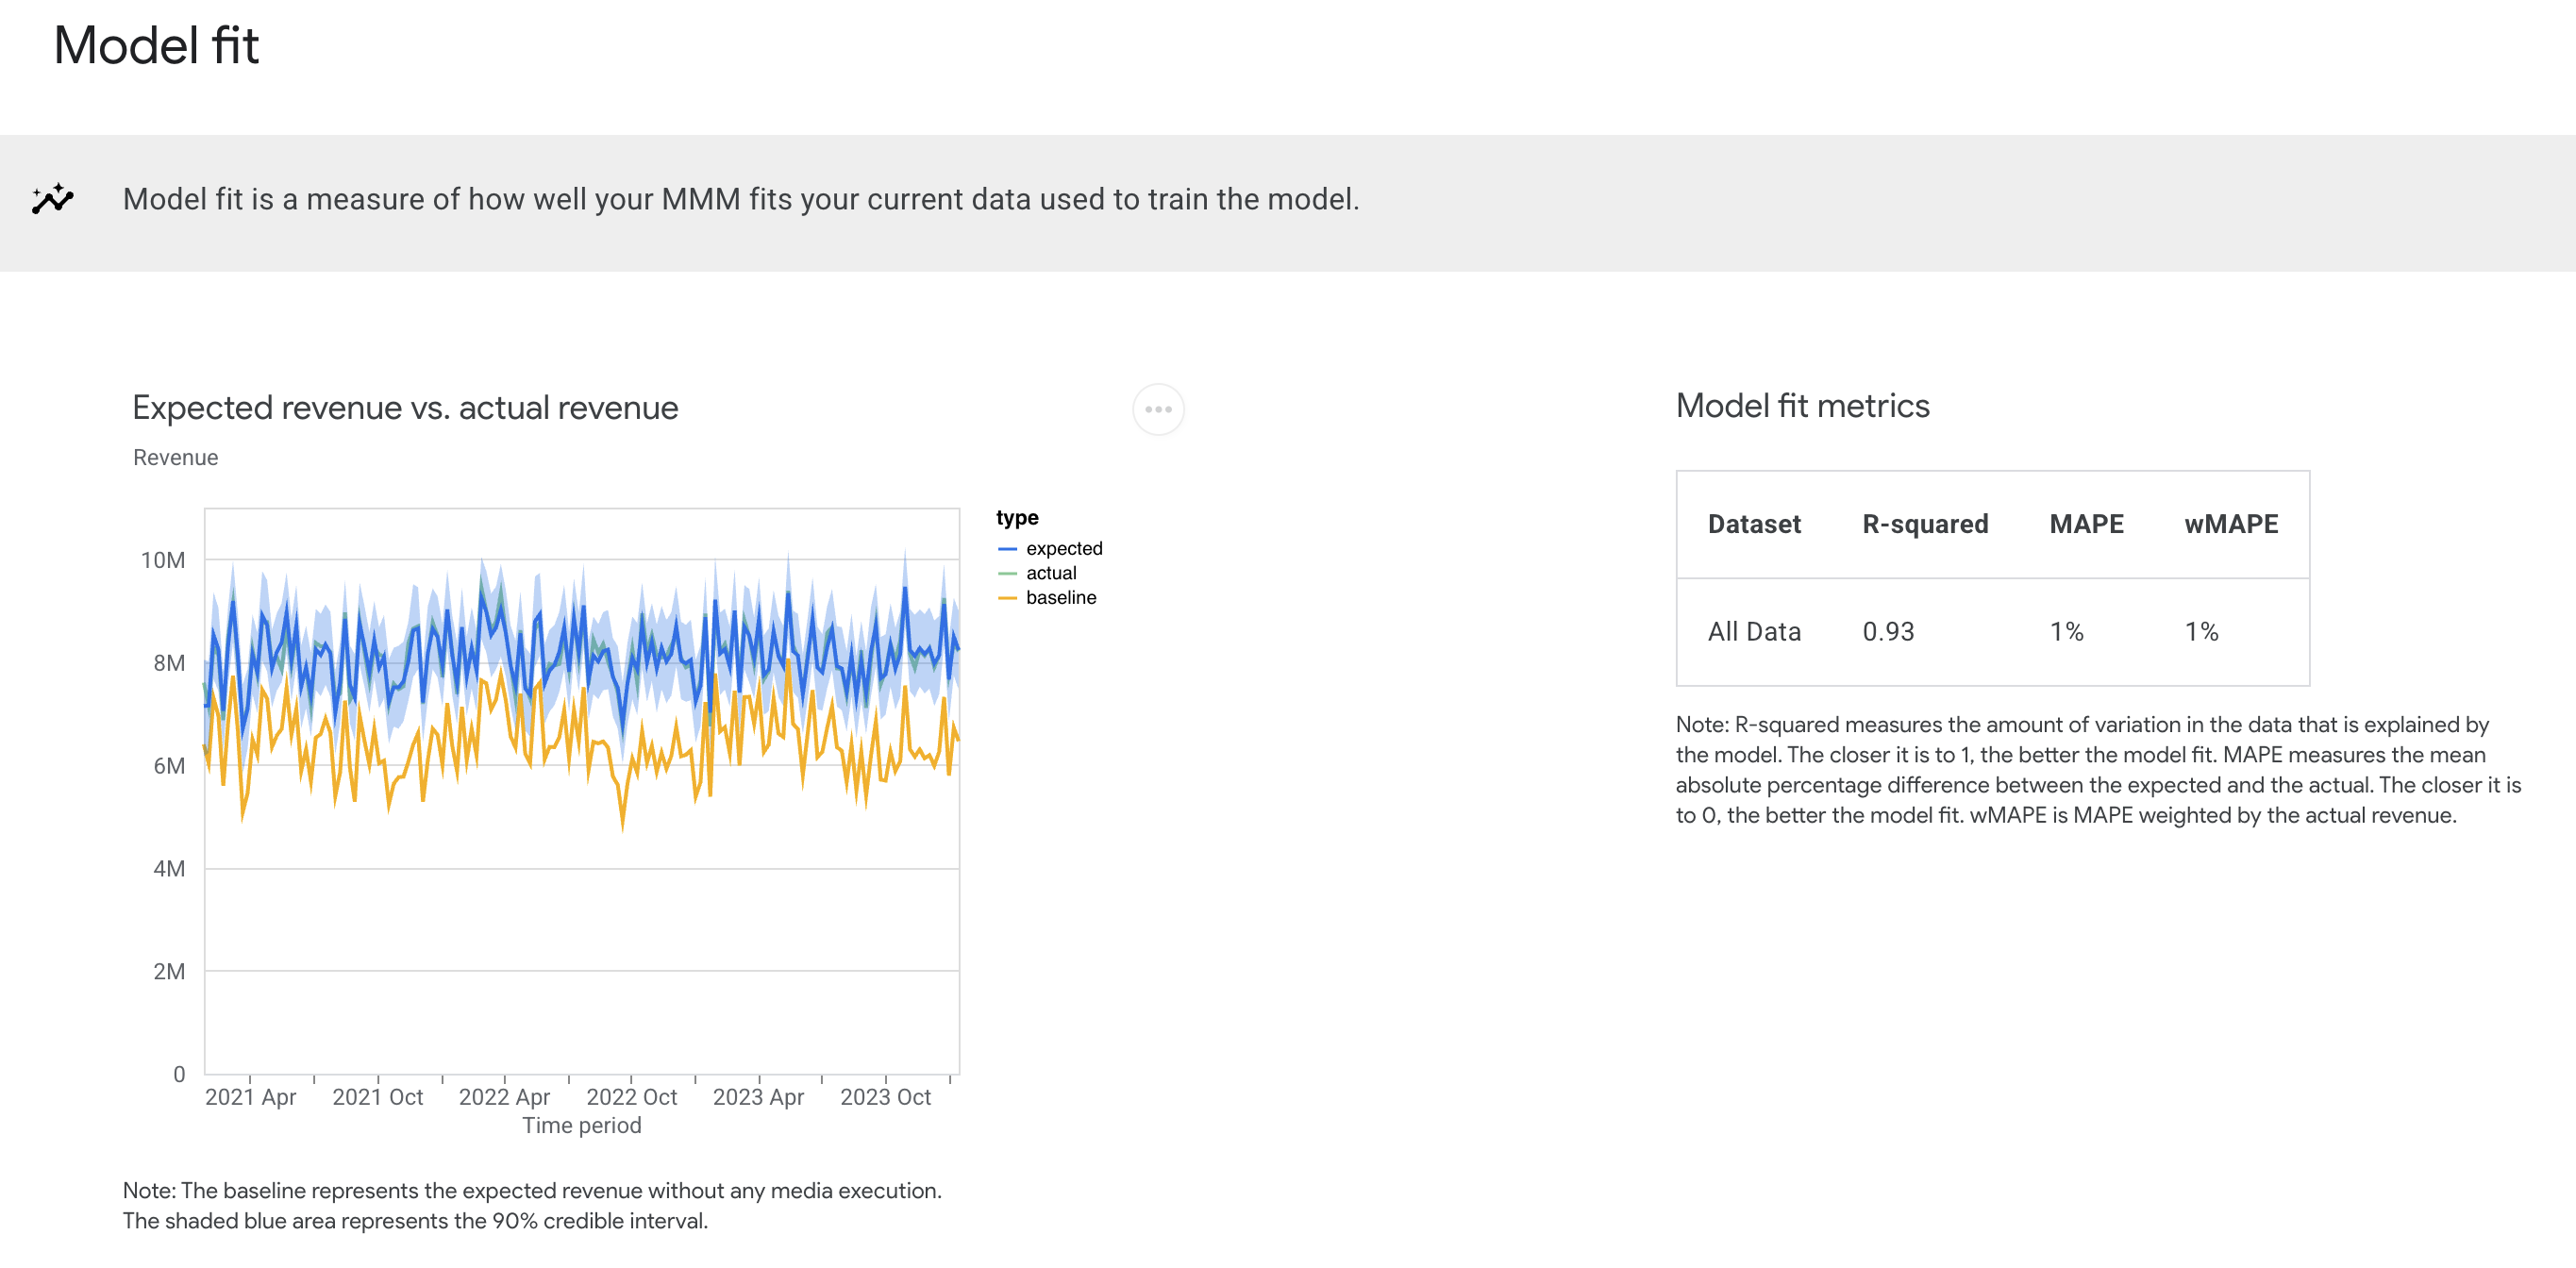
模型拟合度
在模型拟合度部分,您可以检查统计拟合优度。Meridian 会报告模型拟合统计信息,包括 R 平方、平均绝对百分比误差 (MAPE) 和加权平均绝对百分比误差 (wMAPE)。此外,Meridian 还提供将预测收入(或 KPI)与实际收入(或 KPI)数据进行对比的直观表示形式。借助这类图,您可以评估模型的表现,以及确定模型是否欠拟合。
模型拟合统计信息还可用于比较候选模型。不过请注意,拟合优度指标并不能全面反映模型在因果推理方面的效果,用于因果推理的最佳模型可能与用于预测的最佳模型有所不同。
如需了解如何评估模型拟合度,请参阅建模诊断。
输出示例:(点击图片可放大。)
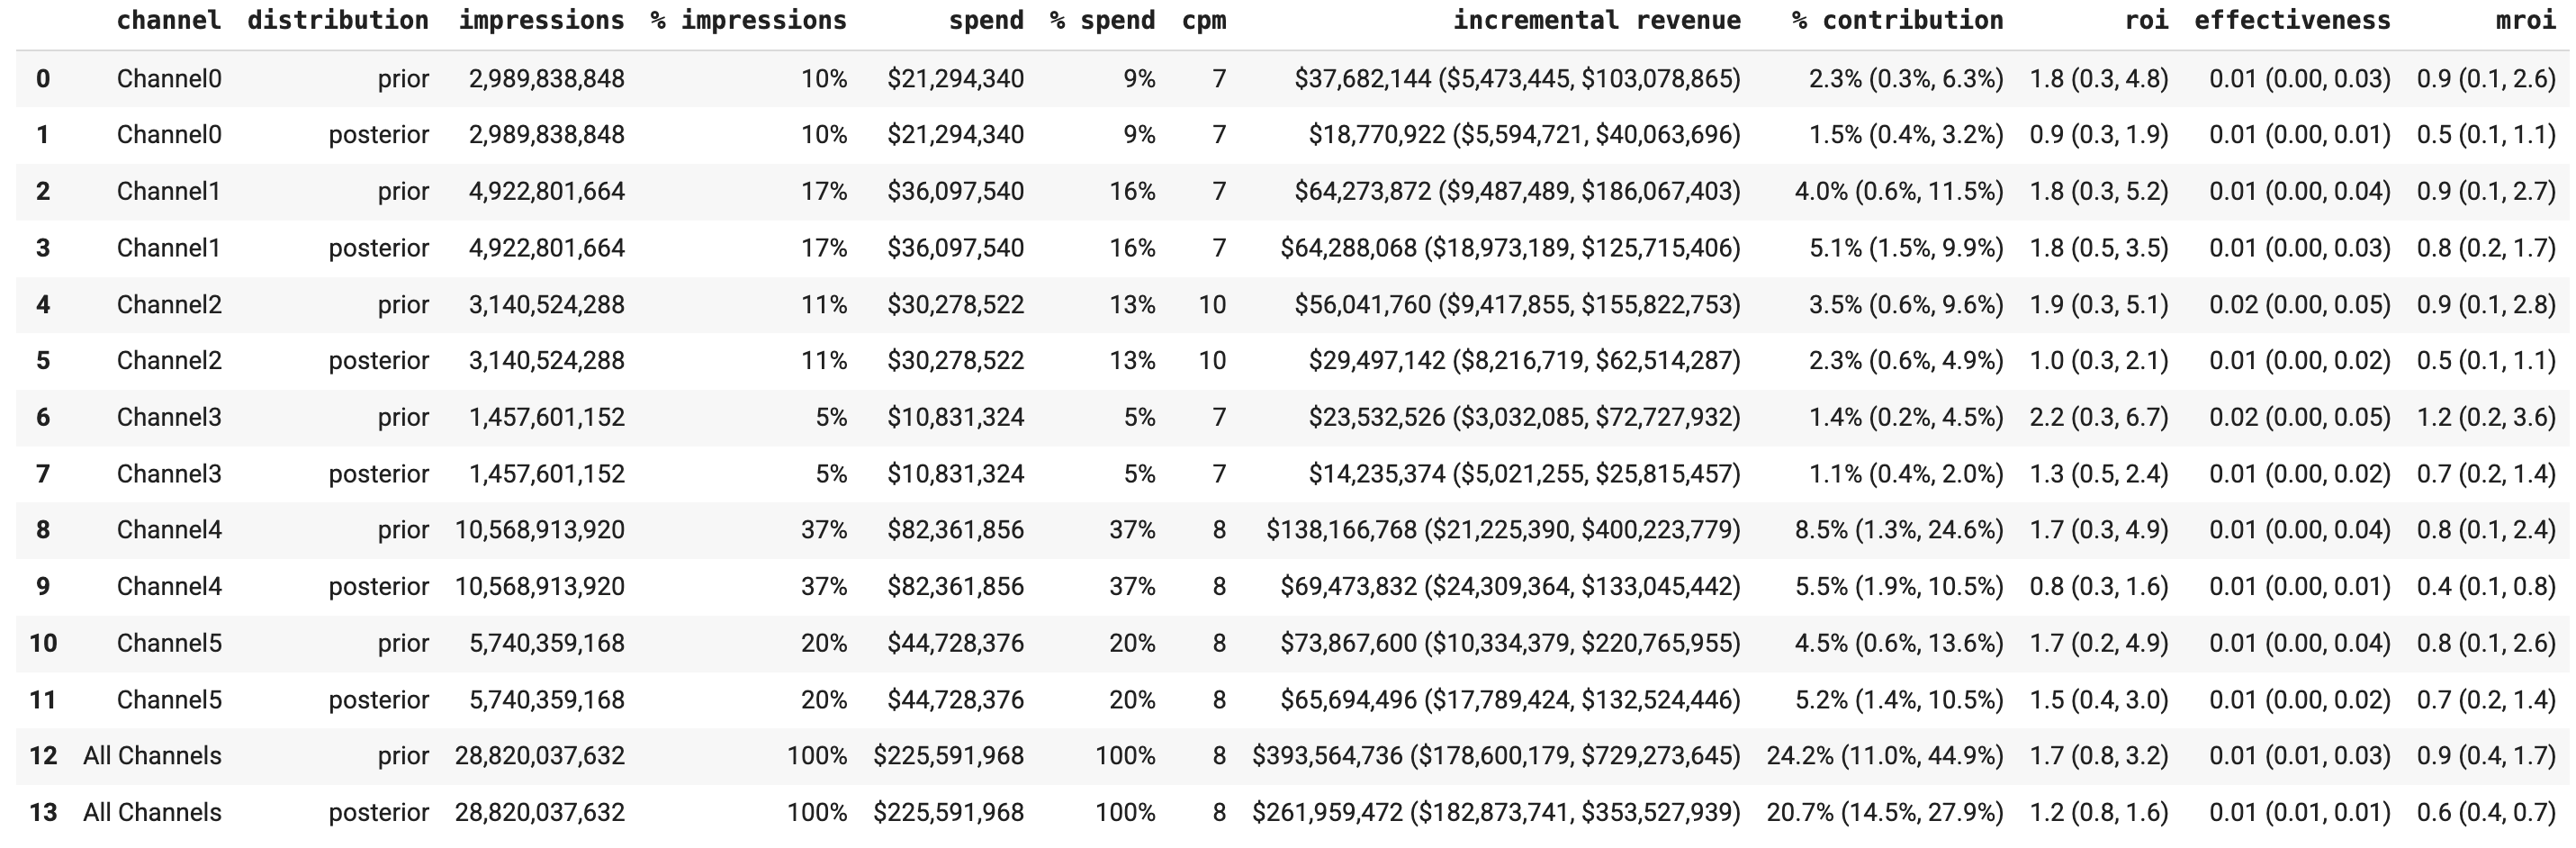
收入或 KPI 贡献
收入或 KPI 贡献部分分析了媒体和非媒体活动对收入或 KPI 表现的影响。在这一部分,您可以比较不同渠道的关键指标,例如投资回报率 (ROI)、支出百分比以及增量收入或增量 KPI 的百分比。此外,您还可以在该部分按基准、降价促销和各种营销渠道细分贡献。
输出示例:(点击图片可放大。)

投资回报率
在投资回报率部分,您可以更深入地了解各个渠道的投资回报率分析,以便找出效果最佳的渠道。您可以比较各个渠道的投资回报率、边际投资回报率和效果。此外,这一部分还提供投资回报率估计的置信区间,这是贝叶斯模型的一大优势。
输出示例:(点击图片可放大。)

最佳分析
最佳分析部分显示了您当前的支出水平,以及每个渠道的支出金额带来的边际回报何时开始递减;还提供了最佳频次建议,以帮助您决定下一年的预算分配重点。
输出示例:

生成模型结果摘要
模型结果摘要通过 MediaSummary 类生成。启动此类时,可以使用 confidence_level 实参指定模型结果的可信区间,并使用 selected_times 实参指定模型估计的时间段。默认使用 90% 可信区间和完整建模窗口生成摘要统计信息。
示例:
运行以下命令可使用默认设置生成摘要:
media_summary = visualizer.MediaSummary(mmm)
media_summary.summary_table()
输出示例:(点击图片可放大。)