Google Analytics Data API v1 可讓您產生資料轉置表。資料透視表是資料匯總工具,可根據一或多個維度將資料主軸 (旋轉) 重新排列,藉此將表格中的資訊重新排列,並將資料視覺化。
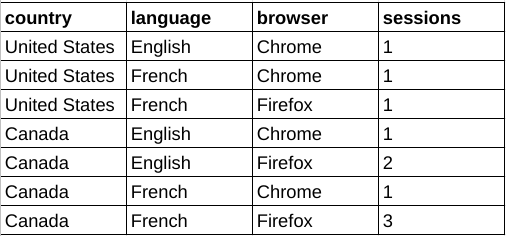
舉例來說,請看下列原始資料表:

您可以使用這項資料建立資料透視表,按瀏覽器細分工作階段資料,並將國家/地區和語言維度選為額外透視表。

與核心報表共用的功能
樞紐報表要求與核心報表要求的語意相同,可用於許多共用功能。舉例來說,分頁、維度篩選器和使用者屬性在樞紐報表中的運作方式與核心報表相同。本指南將著重於樞紐報表功能。如要熟悉 Data API v1 的核心報表功能,請參閱報表基礎知識指南和進階用途指南。
透視報表方法
Data API v1 支援下列報表方法中的樞紐功能:
runPivotReport:這個方法會傳回 Google Analytics 事件資料的自訂樞紐報表。每個樞紐會說明報表回應中顯示的維度欄和列。
batchRunPivotReports:這是
runPivotReport方法的批次版本,可讓您使用單一 API 呼叫產生多份報表。
選取報表實體
Data API v1 的所有方法都需要在網址要求路徑中以 properties/GA_PROPERTY_ID 格式指定 Google Analytics 資源 ID,例如:
POST https://analyticsdata.googleapis.com/v1beta/properties/GA_PROPERTY_ID:runPivotReport
系統會根據指定 Google Analytics 資源中收集到的 Google Analytics 事件資料,產生最終報表。
如果您使用的是 Data API 用戶端程式庫,就不需要手動操作要求網址路徑。大多數 API 用戶端都會提供 property 參數,該參數預期字串格式為 properties/GA_PROPERTY_ID。如需用戶端程式庫的使用範例,請參閱快速入門指南。
索引報表要求
如要建構樞紐資料表要求,請使用 runPivotReport 或 batchRunPivotReports 方法。
如要要求樞紐資料,您可以建構 RunPivotReportRequest 物件。建議您先從下列要求參數開始:
- dateRanges 欄位中的有效項目。
- 維度欄位中至少有一個有效的項目。
- metrics 欄位中至少有一個有效的項目。
- 樞紐欄位中至少有兩個有效的樞紐項目。
以下是含有建議欄位的範例要求:
HTTP
POST https://analyticsdata.googleapis.com/v1beta/properties/GA_PROPERTY_ID:runPivotReport
  {
    "dateRanges": [{ "startDate": "2020-09-01", "endDate": "2020-09-15" }],
    "dimensions": [
        { "name": "browser" },
        { "name": "country" },
        { "name": "language" }
      ],
    "metrics": [{ "name": "sessions" }],
    "pivots": [
      {
        "fieldNames": [
          "browser"
        ],
        "limit": 5
      },
      {
        "fieldNames": [
          "country"
        ],
        "limit": 250
      },
      {
        "fieldNames": [
          "language"
        ],
        "limit": 15
      }
    ]
  }
透視
請使用要求主體 pivot 欄位中的 Pivot 物件,定義報表樞紐。每個 Pivot 都會說明報表回應中可見的維度欄和列。
只要每個樞紐的 limit 參數乘積不超過 100,000,Data API v1 就支援多個樞紐。
以下程式碼片段示範如何使用 pivots 建立按國家/地區劃分的會話次數報表,並以 browser 維度樞紐分析。請注意,查詢如何使用 orderBys 欄位進行排序,以及如何使用 limit 和 offset 欄位實作分頁。
    "pivots": [
      {
        "fieldNames": [
          "country"
        ],
        "limit": 250,
        "orderBys": [
          {
            "dimension": {
              "dimensionName": "country"
            }
          }
        ]
      },
      {
        "fieldNames": [
          "browser"
        ],
        "offset": 3,
        "limit": 3,
        "orderBys": [
          {
            "metric": {
              "metricName": "sessions"
            },
            "desc": true
          }
        ]
      }
    ],
    ...
尺寸
維度可說明及分組網站或應用程式的事件資料。舉例來說,city 維度會指出每個事件的來源城市 (例如「巴黎」或「紐約」)。在報表要求中,您可以指定零個或多個維度。
您必須在要求主體的 dimensions 欄位中定義維度。如要在報表中顯示這些維度,這些維度也必須列在 Pivot 物件的 fieldNames 欄位中。如果維度未用於資料透視查詢的任何透視圖,就不會顯示在報表中。並非每個維度都必須出現在樞紐分析表的 fieldNames 中。維度只能用於篩選器,而不能用於任何資料透視表的 fieldNames。
以下程式碼片段示範如何在包含 browser、country 和 language 樞紐資料表的資料表中使用 dimension 和 fieldNames 欄位:
    "pivots": [
      {
        "fieldNames": [
          "browser"
        ],
        "limit": 5,
        "orderBys": [
          {
            "metric": {
              "metricName": "sessions"
            },
            "desc": true
          }
        ]
      },
      {
        "fieldNames": [
          "country"
        ],
        "limit": 250,
        "orderBys": [
          {
            "dimension": {
              "dimensionName": "country"
            }
          }
        ]
      },
      {
        "fieldNames": [
          "language"
        ],
        "limit": 10
      }
    ],
指標
指標是網站或應用程式事件資料的量化評估。您可以在報表要求中指定一或多個指標。如需在要求中指定的 API 指標名稱完整清單,請參閱「API 指標」。
在資料透視報表要求中,指標會使用要求主體的 metrics 欄位定義,這類似於核心報表方法。
以下範例會指定工作階段計數,做為報表中的指標值:
    "metrics": [
      {
        "name": "sessions"
      }
    ],
指標匯總
使用 Pivot 物件的 metricAggregations 欄位,計算每個樞紐圖的匯總指標值。
只有在要求中指定 metricAggregations 欄位時,系統才會計算匯總資料。
以下是要求 browser 樞紐維度的總數的查詢程式碼片段:
"pivots": [
  {
    "fieldNames": [
      "browser"
    ],
    "limit": 10,
    "metricAggregations": [
      "TOTAL",
    ]
  },
  ...
系統會在 RunPivotReportResponse 物件的 aggregates 欄位中傳回計算的指標。對於匯總指標資料列,dimensionValues 欄位會包含 RESERVED_TOTAL、RESERVED_MAX 或 RESERVED_MIN 的特殊值。
  "aggregates": [
    {
      "dimensionValues": [
        {
          "value": "Chrome"
        },
        {
          "value": "RESERVED_TOTAL"
        },
        {
          "value": "RESERVED_TOTAL"
        }
      ],
      "metricValues": [
        {
          "value": "4"
        }
      ]
    },
    {
      "dimensionValues": [
        {
          "value": "Firefox"
        },
        {
          "value": "RESERVED_TOTAL"
        },
        {
          "value": "RESERVED_TOTAL"
        }
      ],
      "metricValues": [
        {
          "value": "6"
        }
      ]
    },
  ....

  }
分頁
與核心報表方法類似,樞紐要求可讓您在 Pivot 物件中指定 limit 和 offset 欄位,以便實作分頁。分頁設定會個別套用至每個樞紐分析圖。每個 Pivot 物件都必須有 limit 欄位,才能限制報表基數。
只要每個樞紐的 limit 參數乘積不超過 100,000,Data API v1 就支援多個樞紐。
以下程式碼片段示範如何使用 offset 和 limit 欄位,以 10 的偏移值擷取接下來的五個 language 維度:
      {
        "fieldNames": [
          "language"
        ],
        "offset": 10,
        "limit": 5
      }
篩選
與核心報表功能類似,如果要在資料透視報表要求中篩選維度,就必須使用要求範圍的維度篩選器。
排序
您可以使用 Pivot 物件的 orderBys 欄位,針對每個樞紐圖分別控制樞紐圖報表查詢的排序行為,該欄位包含 OrderBy 物件的清單。
每個 OrderBy 可包含下列任一項目:
- DimensionOrderBy:依據維度值排序結果。
- MetricOrderBy,依據指標值排序結果。
- PivotOrderBy:用於樞紐查詢,並依據樞紐資料欄群組內的指標值排序結果。
本範例顯示樞紐定義的程式碼片段,該定義會根據 browser 維度樞紐報表,並依 sessions 指標以降冪順序排序結果。
      {
        "fieldNames": [
          "browser"
        ],
        "limit": 5,
        "orderBys": [
          {
            "metric": {
              "metricName": "sessions"
            },
            "desc": true
          }
        ]
      }
Report Response
樞紐圖表報表 API 要求的樞紐圖表回應主要包含標頭和資料列。
回應標頭
資料透視報表標題包含 PivotHeaders、DimensionHeaders 和 MetricHeaders,這些標題會列出資料透視報表中的欄。
舉例來說,如果報表包含 browser、country 和 language 資料透視維度,以及 sessions 指標,就會產生以下標頭:
{
  "pivotHeaders": [
    {
      "pivotDimensionHeaders": [
        {
          "dimensionValues": [
            {
              "value": "Chrome"
            }
          ]
        },
        {
          "dimensionValues": [
            {
              "value": "Firefox"
            }
          ]
        },
        ...

      ],
      ...
    },
    {
      "pivotDimensionHeaders": [
        {
          "dimensionValues": [
            {
              "value": "United States"
            }
          ]
        },
        {
          "dimensionValues": [
            {
              "value": "Canada"
            }
          ]
        },
        ...

      ],
      ...
    },
    {
      "pivotDimensionHeaders": [
        {
          "dimensionValues": [
            {
              "value": "English"
            }
          ]
        },
        {
          "dimensionValues": [
            {
              "value": "French"
            }
          ]
        },
        ...

      ],
      ...
    }
  ],
  "dimensionHeaders": [
    {
      "name": "browser"
    },
    {
      "name": "country"
    },
    {
      "name": "language"
    }
  ],
  "metricHeaders": [
    {
      "name": "sessions",
      "type": "TYPE_INTEGER"
    }
  ],
  ...

}
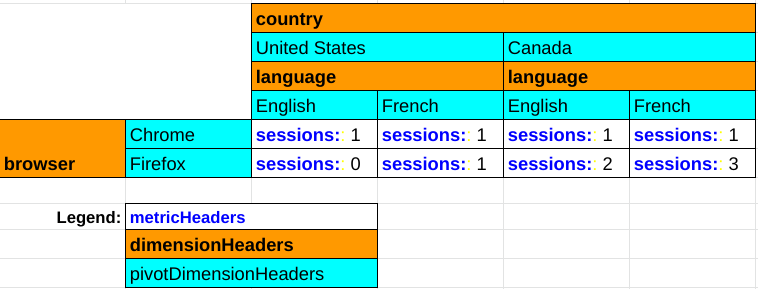
下圖說明樞紐圖報表回應的各個元件在轉譯樞紐圖報表時所扮演的角色:

回應列
runPivotReport 和 batchRunPivotReports 方法的樞紐圖表回應,與 runReport 和 batchRunReports 等核心報表方法的回應不同,因為每個樞紐圖表回應列代表資料表的單一儲存格,而在一般報表中,單一回應列則代表完整的資料表行。
以下是資料透視報表回應的片段,該回應是針對包含 browser、country 和 language 資料透視維度和 sessions 指標的查詢。樞紐報表的每個儲存格都會個別傳回:
  "rows": [
    {
      "dimensionValues": [
        {
          "value": "Chrome"
        },
        {
          "value": "United States"
        },
        {
          "value": "English"
        }
      ],
      "metricValues": [
        {
          "value": "1"
        }
      ]
    },
    {
      "dimensionValues": [
        {
          "value": "Firefox"
        },
        {
          "value": "Canada"
        },
        {
          "value": "French"
        }
      ],
      "metricValues": [
        {
          "value": "3"
        }
      ]
    },
    ...

  ]
這項資料對應至下表中醒目顯示的兩個儲存格:

用戶端程式庫
以下範例使用用戶端程式庫執行樞紐查詢,以便根據瀏覽器維度建立按國家/地區劃分的工作階段計數報表。
PHP
use Google\Analytics\Data\V1beta\Client\BetaAnalyticsDataClient; use Google\Analytics\Data\V1beta\DateRange; use Google\Analytics\Data\V1beta\Dimension; use Google\Analytics\Data\V1beta\Metric; use Google\Analytics\Data\V1beta\OrderBy; use Google\Analytics\Data\V1beta\OrderBy\DimensionOrderBy; use Google\Analytics\Data\V1beta\OrderBy\MetricOrderBy; use Google\Analytics\Data\V1beta\Pivot; use Google\Analytics\Data\V1beta\RunPivotReportRequest; use Google\Analytics\Data\V1beta\RunPivotReportResponse; /** * Runs a pivot query to build a report of session counts by country, * pivoted by the browser dimension. * @param string $propertyId Your GA-4 Property ID */ function run_pivot_report(string $propertyId) { // Create an instance of the Google Analytics Data API client library. $client = new BetaAnalyticsDataClient(); // Make an API call. $request = (new RunPivotReportRequest()) ->setProperty('properties/' . $propertyId) ->setDateRanges([new DateRange([ 'start_date' => '2021-01-01', 'end_date' => '2021-01-30', ]), ]) ->setPivots([ new Pivot([ 'field_names' => ['country'], 'limit' => 250, 'order_bys' => [new OrderBy([ 'dimension' => new DimensionOrderBy([ 'dimension_name' => 'country', ]), ])], ]), new Pivot([ 'field_names' => ['browser'], 'offset' => 3, 'limit' => 3, 'order_bys' => [new OrderBy([ 'metric' => new MetricOrderBy([ 'metric_name' => 'sessions', ]), 'desc' => true, ])], ]), ]) ->setMetrics([new Metric(['name' => 'sessions'])]) ->setDimensions([ new Dimension(['name' => 'country']), new Dimension(['name' => 'browser']), ]); $response = $client->runPivotReport($request); printPivotReportResponse($response); } /** * Print results of a runPivotReport call. * @param RunPivotReportResponse $response */ function printPivotReportResponse(RunPivotReportResponse $response) { print 'Report result: ' . PHP_EOL; foreach ($response->getRows() as $row) { printf( '%s %s' . PHP_EOL, $row->getDimensionValues()[0]->getValue(), $row->getMetricValues()[0]->getValue() ); } }
Python
from google.analytics.data_v1beta import BetaAnalyticsDataClient from google.analytics.data_v1beta.types import ( DateRange, Dimension, Metric, OrderBy, Pivot, RunPivotReportRequest, ) def run_sample(): """Runs the sample.""" # TODO(developer): Replace this variable with your Google Analytics 4 # property ID before running the sample. property_id = "YOUR-GA4-PROPERTY-ID" run_pivot_report(property_id) def run_pivot_report(property_id="YOUR-GA4-PROPERTY-ID"): """Runs a pivot query to build a report of session counts by country, pivoted by the browser dimension.""" client = BetaAnalyticsDataClient() request = RunPivotReportRequest( property=f"properties/{property_id}", date_ranges=[DateRange(start_date="2021-01-01", end_date="2021-01-30")], pivots=[ Pivot( field_names=["country"], limit=250, order_bys=[ OrderBy( dimension=OrderBy.DimensionOrderBy(dimension_name="country") ) ], ), Pivot( field_names=["browser"], offset=3, limit=3, order_bys=[ OrderBy( metric=OrderBy.MetricOrderBy(metric_name="sessions"), desc=True ) ], ), ], metrics=[Metric(name="sessions")], dimensions=[Dimension(name="country"), Dimension(name="browser")], ) response = client.run_pivot_report(request) print_run_pivot_report_response(response) def print_run_pivot_report_response(response): """Prints results of a runPivotReport call.""" print("Report result:") for row in response.rows: for dimension_value in row.dimension_values: print(dimension_value.value) for metric_value in row.metric_values: print(metric_value.value)
Node.js
// TODO(developer): Uncomment this variable and replace with your // Google Analytics 4 property ID before running the sample. // propertyId = 'YOUR-GA4-PROPERTY-ID'; // Imports the Google Analytics Data API client library. const {BetaAnalyticsDataClient} = require('@google-analytics/data'); // Initialize client that will be used to send requests. This client only // needs to be created once, and can be reused for multiple requests. const analyticsDataClient = new BetaAnalyticsDataClient(); // Runs a pivot query to build a report of session counts by country, pivoted by the browser dimension. async function runPivotReport() { const [response] = await analyticsDataClient.runPivotReport({ property: `properties/${propertyId}`, dateRanges: [ { startDate: '2021-01-01', endDate: '2021-01-30', }, ], pivots: [ { fieldNames: ['country'], limit: 250, orderBys: [ { dimension: { dimensionName: 'country', }, }, ], }, { fieldNames: ['browser'], offset: 3, limit: 3, orderBys: [ { metric: { metricName: 'sessions', }, desc: true, }, ], }, ], metrics: [ { name: 'sessions', }, ], dimensions: [ { name: 'country', }, { name: 'browser', }, ], }); printPivotReportResponse(response); } runPivotReport(); // Prints results of a runReport call. function printPivotReportResponse(response) { console.log('Report result:'); response.rows.forEach(row => { row.dimensionValues.forEach(dimensionValue => { console.log(dimensionValue.value); }); row.metricValues.forEach(metricValue => { console.log(metricValue.value); }); }); }
試用版應用程式
如需使用 JavaScript 建構及顯示樞紐分析報表的範例,請參閱 Google Analytics API v1 樞紐分析報表示範應用程式。
