
借助 Google Analytics Data API v1,您可以生成数据透视表。数据透视表是一种数据汇总工具,可通过按一个或多个维度透视(旋转)数据来重新排列表格中的信息,从而直观呈现数据。
例如,请考虑以下原始数据表格:
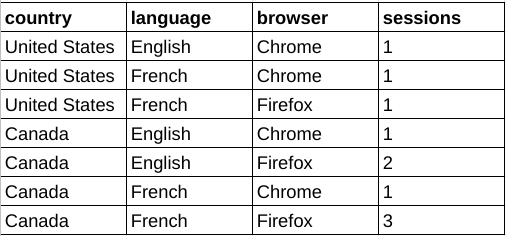
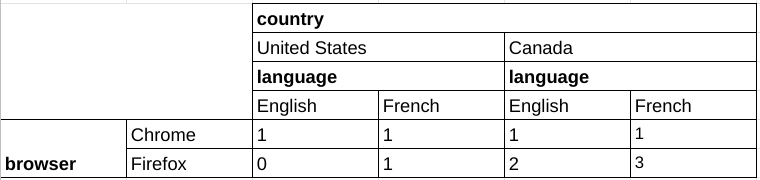
利用这些数据,您可以构建一个数据透视表,按浏览器对会话数据进行细分,并将国家/地区和语言维度选作其他数据透视。
与核心报告共享的功能
对于许多共享功能,数据透视报告请求与核心报告请求具有相同的语义。例如,分页、维度过滤条件和用户属性在数据透视表报告中的运作方式与核心报告中的运作方式相同。本指南重点介绍数据透视报告功能。如需熟悉 Data API v1 的核心报告功能,请参阅报告基础知识指南以及高级用例指南。
透视报告方法
Data API v1 的以下报告方法支持数据透视功能:
runPivotReport:此方法会返回包含 Google Analytics 事件数据的自定义数据透视报告。每个数据透视描述了报告响应中的可见维度列和行。
batchRunPivotReports:此方法是
runPivotReport方法的批处理版本,允许使用单个 API 调用生成多个报告。
选择报告实体
Data API v1 的所有方法都要求在网址请求路径中以 properties/GA_PROPERTY_ID 的形式指定 Google Analytics 媒体资源标识符,例如:
POST https://analyticsdata.googleapis.com/v1beta/properties/GA_PROPERTY_ID:runPivotReport
系统将根据在指定 Google Analytics 媒体资源中收集的 Google Analytics 事件数据生成报告。
如果您使用的是 Data API 客户端库之一,则无需手动操作请求网址路径。大多数 API 客户端都会提供一个 property 参数,该参数需要 properties/GA_PROPERTY_ID 形式的字符串。如需查看有关如何使用客户端库的示例,请参阅快速入门指南。
透视报告请求
如需构建包含数据透视表的请求,请使用 runPivotReport 或 batchRunPivotReports 方法。
如需请求汇总数据,您可以构建 RunPivotReportRequest 对象。我们建议您先使用以下请求参数:
- dateRanges 字段中有效的条目。
- dimensions 字段中至少有一个有效条目。
- metrics 字段中至少有一个有效条目。
- pivots 字段中至少包含两个有效的 pivot 条目。
以下是包含建议字段的请求示例:
HTTP
POST https://analyticsdata.googleapis.com/v1beta/properties/GA_PROPERTY_ID:runPivotReport
  {
    "dateRanges": [{ "startDate": "2020-09-01", "endDate": "2020-09-15" }],
    "dimensions": [
        { "name": "browser" },
        { "name": "country" },
        { "name": "language" }
      ],
    "metrics": [{ "name": "sessions" }],
    "pivots": [
      {
        "fieldNames": [
          "browser"
        ],
        "limit": 5
      },
      {
        "fieldNames": [
          "country"
        ],
        "limit": 250
      },
      {
        "fieldNames": [
          "language"
        ],
        "limit": 15
      }
    ]
  }
数据透视
在请求正文的 pivot 字段中使用 Pivot 对象来定义报告数据透视。每个 Pivot 都描述了报告响应中的可见维度列和行。
只要每个数据透视的 limit 参数的乘积不超过 100,000,Data API v1 便可支持多个数据透视。
以下代码段演示了如何使用 pivots 按国家/地区生成会话数报告,并按 browser 维度透视数据。请注意查询如何使用 orderBys 字段进行排序,以及如何使用 limit 和 offset 字段实现分页。
    "pivots": [
      {
        "fieldNames": [
          "country"
        ],
        "limit": 250,
        "orderBys": [
          {
            "dimension": {
              "dimensionName": "country"
            }
          }
        ]
      },
      {
        "fieldNames": [
          "browser"
        ],
        "offset": 3,
        "limit": 3,
        "orderBys": [
          {
            "metric": {
              "metricName": "sessions"
            },
            "desc": true
          }
        ]
      }
    ],
    ...
维度
维度用于描述和分组网站或应用的事件数据。例如,“city”维度表示每个事件的发源城市(“巴黎”或“纽约”)。在报告请求中,您可以指定零个或多个维度。
维度必须在请求正文的 dimensions 字段中定义。为了在报告中显示这些维度,还必须在 Pivot 对象的 fieldNames 字段中列出这些维度。如果某个维度未用于数据透视查询的任何数据透视,则将不会显示在报告中。并非每个维度都必须出现在数据透视表的 fieldNames 中。维度只能在过滤条件中使用,不能在任何数据透视的 fieldNames 中使用。
以下代码段演示了如何针对包含 browser、country 和 language 数据透视表的表使用 dimension 和 fieldNames 字段:
    "pivots": [
      {
        "fieldNames": [
          "browser"
        ],
        "limit": 5,
        "orderBys": [
          {
            "metric": {
              "metricName": "sessions"
            },
            "desc": true
          }
        ]
      },
      {
        "fieldNames": [
          "country"
        ],
        "limit": 250,
        "orderBys": [
          {
            "dimension": {
              "dimensionName": "country"
            }
          }
        ]
      },
      {
        "fieldNames": [
          "language"
        ],
        "limit": 10
      }
    ],
指标
指标是对网站或应用事件数据的量化衡量。您可以在报告请求中指定一个或多个指标。如需查看可在请求中指定的 API 指标名称的完整列表,请参阅 API 指标。
在数据透视报告请求中,指标是使用请求正文的 metrics 字段定义的,这与核心报告方法类似。
以下示例指定了将会话数用作报告中指标值:
    "metrics": [
      {
        "name": "sessions"
      }
    ],
指标汇总
使用 Pivot 对象的 metricAggregations 字段计算每个数据透视的汇总指标值。
只有在请求中指定 metricAggregations 字段时,系统才会计算聚合值。
以下是请求 browser 数据透视维度总数的查询代码段:
"pivots": [
  {
    "fieldNames": [
      "browser"
    ],
    "limit": 10,
    "metricAggregations": [
      "TOTAL",
    ]
  },
  ...
计算的指标会在 RunPivotReportResponse 对象的 aggregates 字段中返回。对于汇总指标行,dimensionValues 字段包含特殊值 RESERVED_TOTAL、RESERVED_MAX 或 RESERVED_MIN。
  "aggregates": [
    {
      "dimensionValues": [
        {
          "value": "Chrome"
        },
        {
          "value": "RESERVED_TOTAL"
        },
        {
          "value": "RESERVED_TOTAL"
        }
      ],
      "metricValues": [
        {
          "value": "4"
        }
      ]
    },
    {
      "dimensionValues": [
        {
          "value": "Firefox"
        },
        {
          "value": "RESERVED_TOTAL"
        },
        {
          "value": "RESERVED_TOTAL"
        }
      ],
      "metricValues": [
        {
          "value": "6"
        }
      ]
    },
  ....

  }
分页
与核心报告方法类似,您可以使用数据透视请求在数据透视对象中指定 limit 和 offset 字段,以实现分页。分页设置会分别应用于每个数据透视表。
每个 Pivot 对象都必须包含 limit 字段,以限制报告基数。
只要每个数据透视的 limit 参数的乘积不超过 100,000,Data API v1 便可支持多个数据透视。
以下代码段演示了如何使用 offset 和 limit 字段检索偏移量为 10 的下五个 language 维度:
      {
        "fieldNames": [
          "language"
        ],
        "offset": 10,
        "limit": 5
      }
过滤
与核心报告功能类似,如果数据透视报告请求中需要进行维度过滤,则必须使用请求范围的维度过滤条件。
排序
您可以使用 Pivot 对象的 orderBys 字段(其中包含 OrderBy 对象的列表)分别控制每个数据透视报告查询的排序行为。
每个 OrderBy 都可以包含以下各项之一:
- DimensionOrderBy,按维度值对结果进行排序。
- MetricOrderBy,按指标值对结果进行排序。
- PivotOrderBy,用于数据透视查询,并按数据透视列组中的指标值对结果进行排序。
以下示例展示了按 browser 维度对报告进行数据透视的汇总定义的代码段,并按 sessions 指标对结果进行降序排序。
      {
        "fieldNames": [
          "browser"
        ],
        "limit": 5,
        "orderBys": [
          {
            "metric": {
              "metricName": "sessions"
            },
            "desc": true
          }
        ]
      }
举报回复
数据透视报告 API 请求的数据透视报告响应主要包含标题和行。
响应标头
数据透视报告标题由 PivotHeaders、DimensionHeaders 和 MetricHeaders 组成,其中列出了数据透视报告中的列。
例如,如果报告包含 browser、country 和 language 透视维度以及 sessions 指标,则会生成如下标题:
{
  "pivotHeaders": [
    {
      "pivotDimensionHeaders": [
        {
          "dimensionValues": [
            {
              "value": "Chrome"
            }
          ]
        },
        {
          "dimensionValues": [
            {
              "value": "Firefox"
            }
          ]
        },
        ...

      ],
      ...
    },
    {
      "pivotDimensionHeaders": [
        {
          "dimensionValues": [
            {
              "value": "United States"
            }
          ]
        },
        {
          "dimensionValues": [
            {
              "value": "Canada"
            }
          ]
        },
        ...

      ],
      ...
    },
    {
      "pivotDimensionHeaders": [
        {
          "dimensionValues": [
            {
              "value": "English"
            }
          ]
        },
        {
          "dimensionValues": [
            {
              "value": "French"
            }
          ]
        },
        ...

      ],
      ...
    }
  ],
  "dimensionHeaders": [
    {
      "name": "browser"
    },
    {
      "name": "country"
    },
    {
      "name": "language"
    }
  ],
  "metricHeaders": [
    {
      "name": "sessions",
      "type": "TYPE_INTEGER"
    }
  ],
  ...

}
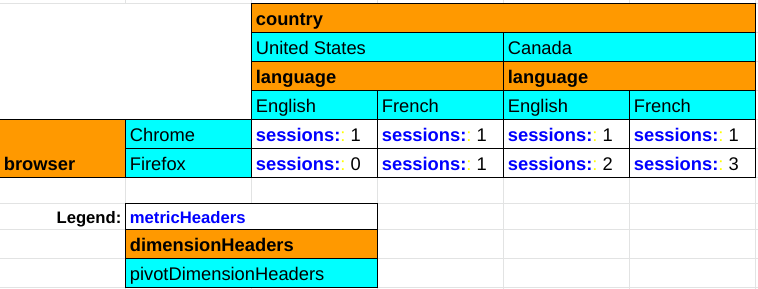
下图说明了数据透视报告响应中每个组件在呈现数据透视报告中的作用:
响应行
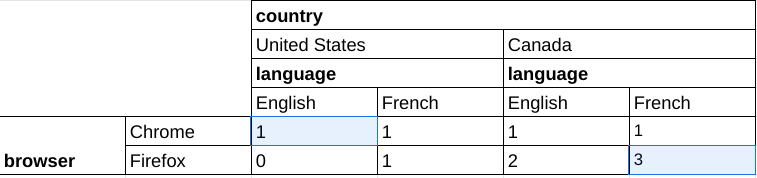
runPivotReport 和 batchRunPivotReports 方法的数据透视报告响应与核心报告方法(例如 runReport 和 batchRunReports)的响应不同,因为每个数据透视报告响应行都代表表格中的单个单元格,而在常规报告中,一个响应行代表表格中完整的一行。
以下是针对包含 browser、country 和 language 数据透视维度以及 sessions 指标的查询的透视报告响应的片段。系统会单独返回数据透视报告的每个单元格:
  "rows": [
    {
      "dimensionValues": [
        {
          "value": "Chrome"
        },
        {
          "value": "United States"
        },
        {
          "value": "English"
        }
      ],
      "metricValues": [
        {
          "value": "1"
        }
      ]
    },
    {
      "dimensionValues": [
        {
          "value": "Firefox"
        },
        {
          "value": "Canada"
        },
        {
          "value": "French"
        }
      ],
      "metricValues": [
        {
          "value": "3"
        }
      ]
    },
    ...

  ]
这些数据对应于下表中突出显示的两个单元格:
客户端库
以下示例使用客户端库运行数据透视查询,按国家/地区生成会话数报告,并按浏览器维度透视数据。
PHP
use Google\Analytics\Data\V1beta\Client\BetaAnalyticsDataClient; use Google\Analytics\Data\V1beta\DateRange; use Google\Analytics\Data\V1beta\Dimension; use Google\Analytics\Data\V1beta\Metric; use Google\Analytics\Data\V1beta\OrderBy; use Google\Analytics\Data\V1beta\OrderBy\DimensionOrderBy; use Google\Analytics\Data\V1beta\OrderBy\MetricOrderBy; use Google\Analytics\Data\V1beta\Pivot; use Google\Analytics\Data\V1beta\RunPivotReportRequest; use Google\Analytics\Data\V1beta\RunPivotReportResponse; /** * Runs a pivot query to build a report of session counts by country, * pivoted by the browser dimension. * @param string $propertyId Your GA-4 Property ID */ function run_pivot_report(string $propertyId) { // Create an instance of the Google Analytics Data API client library. $client = new BetaAnalyticsDataClient(); // Make an API call. $request = (new RunPivotReportRequest()) ->setProperty('properties/' . $propertyId) ->setDateRanges([new DateRange([ 'start_date' => '2021-01-01', 'end_date' => '2021-01-30', ]), ]) ->setPivots([ new Pivot([ 'field_names' => ['country'], 'limit' => 250, 'order_bys' => [new OrderBy([ 'dimension' => new DimensionOrderBy([ 'dimension_name' => 'country', ]), ])], ]), new Pivot([ 'field_names' => ['browser'], 'offset' => 3, 'limit' => 3, 'order_bys' => [new OrderBy([ 'metric' => new MetricOrderBy([ 'metric_name' => 'sessions', ]), 'desc' => true, ])], ]), ]) ->setMetrics([new Metric(['name' => 'sessions'])]) ->setDimensions([ new Dimension(['name' => 'country']), new Dimension(['name' => 'browser']), ]); $response = $client->runPivotReport($request); printPivotReportResponse($response); } /** * Print results of a runPivotReport call. * @param RunPivotReportResponse $response */ function printPivotReportResponse(RunPivotReportResponse $response) { print 'Report result: ' . PHP_EOL; foreach ($response->getRows() as $row) { printf( '%s %s' . PHP_EOL, $row->getDimensionValues()[0]->getValue(), $row->getMetricValues()[0]->getValue() ); } }
Python
from google.analytics.data_v1beta import BetaAnalyticsDataClient from google.analytics.data_v1beta.types import ( DateRange, Dimension, Metric, OrderBy, Pivot, RunPivotReportRequest, ) def run_sample(): """Runs the sample.""" # TODO(developer): Replace this variable with your Google Analytics 4 # property ID before running the sample. property_id = "YOUR-GA4-PROPERTY-ID" run_pivot_report(property_id) def run_pivot_report(property_id="YOUR-GA4-PROPERTY-ID"): """Runs a pivot query to build a report of session counts by country, pivoted by the browser dimension.""" client = BetaAnalyticsDataClient() request = RunPivotReportRequest( property=f"properties/{property_id}", date_ranges=[DateRange(start_date="2021-01-01", end_date="2021-01-30")], pivots=[ Pivot( field_names=["country"], limit=250, order_bys=[ OrderBy( dimension=OrderBy.DimensionOrderBy(dimension_name="country") ) ], ), Pivot( field_names=["browser"], offset=3, limit=3, order_bys=[ OrderBy( metric=OrderBy.MetricOrderBy(metric_name="sessions"), desc=True ) ], ), ], metrics=[Metric(name="sessions")], dimensions=[Dimension(name="country"), Dimension(name="browser")], ) response = client.run_pivot_report(request) print_run_pivot_report_response(response) def print_run_pivot_report_response(response): """Prints results of a runPivotReport call.""" print("Report result:") for row in response.rows: for dimension_value in row.dimension_values: print(dimension_value.value) for metric_value in row.metric_values: print(metric_value.value)
Node.js
// TODO(developer): Uncomment this variable and replace with your // Google Analytics 4 property ID before running the sample. // propertyId = 'YOUR-GA4-PROPERTY-ID'; // Imports the Google Analytics Data API client library. const {BetaAnalyticsDataClient} = require('@google-analytics/data'); // Initialize client that will be used to send requests. This client only // needs to be created once, and can be reused for multiple requests. const analyticsDataClient = new BetaAnalyticsDataClient(); // Runs a pivot query to build a report of session counts by country, pivoted by the browser dimension. async function runPivotReport() { const [response] = await analyticsDataClient.runPivotReport({ property: `properties/${propertyId}`, dateRanges: [ { startDate: '2021-01-01', endDate: '2021-01-30', }, ], pivots: [ { fieldNames: ['country'], limit: 250, orderBys: [ { dimension: { dimensionName: 'country', }, }, ], }, { fieldNames: ['browser'], offset: 3, limit: 3, orderBys: [ { metric: { metricName: 'sessions', }, desc: true, }, ], }, ], metrics: [ { name: 'sessions', }, ], dimensions: [ { name: 'country', }, { name: 'browser', }, ], }); printPivotReportResponse(response); } runPivotReport(); // Prints results of a runReport call. function printPivotReportResponse(response) { console.log('Report result:'); response.rows.forEach(row => { row.dimensionValues.forEach(dimensionValue => { console.log(dimensionValue.value); }); row.metricValues.forEach(metricValue => { console.log(metricValue.value); }); }); }
演示应用
如需查看使用 JavaScript 构建和显示数据透视表的示例,请参阅 Google Analytics API v1 数据透视表演示版应用。