Use the Reports Builder for Google Analytics Google Sheets add-on to create and run reports for Google Analytics properties using Google Sheets. This add-on lets you pull Google Analytics data directly into your spreadsheet using either natural language or manual configuration.
Install the add-on
Here's what you'll need before you can start using the add-on.
Install the Reports Builder for Google Analytics Google Sheets add-on from the Google Workspace Marketplace.
You can also access the add-on store listing through the Google Sheets menu by selecting Extensions > Add-ons > Get add-ons, and searching for Reports Builder for Google Analytics.
Open the add-on listing, and click Install to install the add-on.
Follow the prompt to complete the installation process.
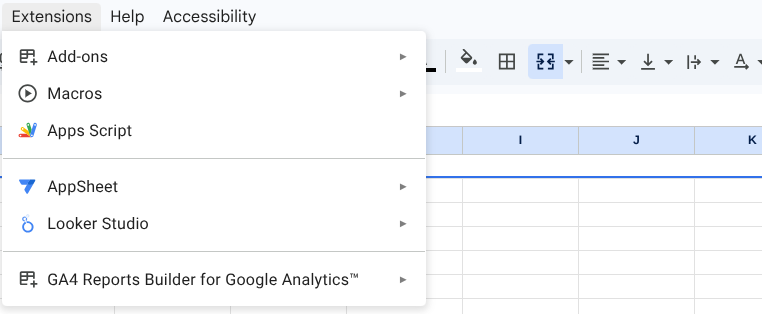
After you've finished installing the add-on, create a new Google Sheet. You will find the add-on under Extensions > GA4 Report Builder for Google Analytics™ in the menu.
How the tool works
After you've installed the Google Sheets add-on, you can create a report configuration and run the report.
Create a new report
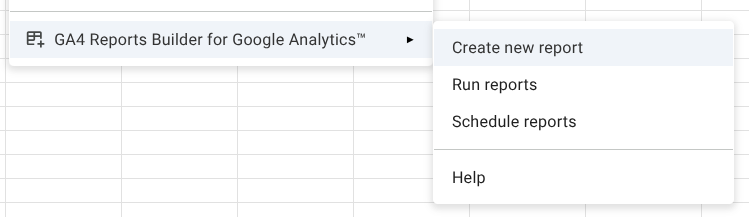
To invoke the report configuration dialog, select the Create new report option from the add-on menu.
Select Your Data Source
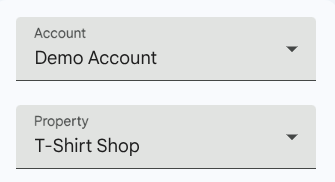
Account: To begin the report configuration, select an account from the Account drop-down menu, which is prepopulated with the list of Google Analytics accounts available to the signed-in user.
Property: Use the Property dropdown to select the specific web or app property you want to analyze.
Configure your report (two methods)
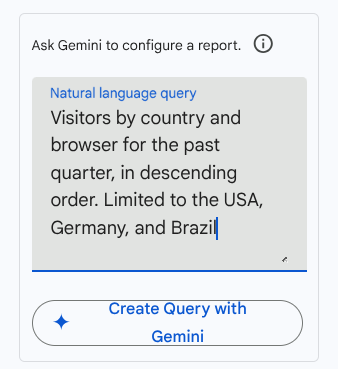
Method A: Use Gemini (AI-assisted)
Locate the Natural language query box.
Type your request in your language. For example:
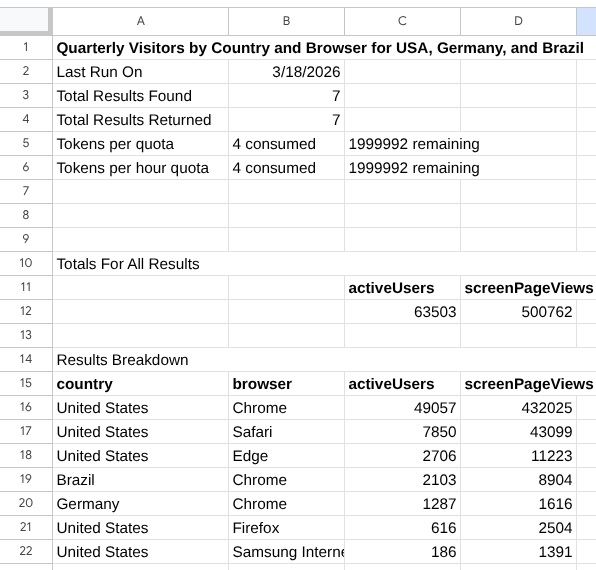
Visitors by country and browser for the past quarter, in descending order. Limited to the USA, Germany, and Brazil
- Click Create Query with Gemini. The add-on will automatically populate the dimensions, metrics, and date ranges for you.
Method B: Manual Setup
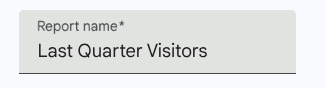
Report Name: Give your report a brief descriptive title.
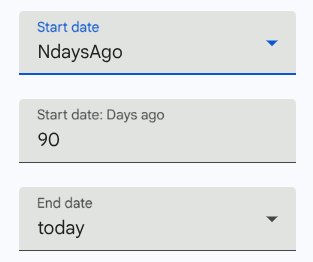
Date Range: Select from presets like NdaysAgo or today, or enter specific dates.
Dimensions: Add dimensions like
CountryorBrowserto categorize your data.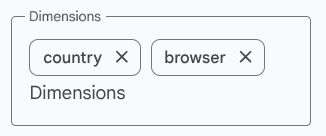
Metrics: Add quantitative metrics like
activeUsersorscreenPageViews.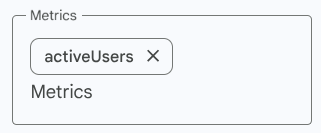
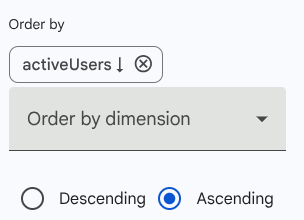
Order By: (Optional) Choose to sort your results by a specific metric or dimension in ascending or descending order.
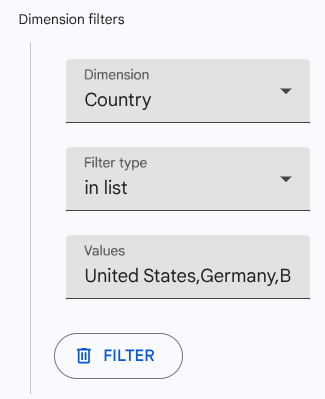
Dimension Filters: (Optional) Limit your data to specific criteria. For example, only show data where the Country is "United States, Germany, or Brazil".
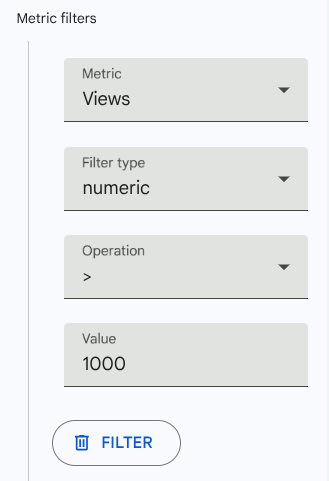
Metric Filters: (Optional) Add logic to show only those rows that meet certain numerical thresholds.
Finalize and Run
Save Report Configuration: Saves your settings so you can run this specific report again later. A new report configuration will be added to the "Report Configuration" sheet.
Run Report: Executes the query and imports the data directly into your Google Sheet. If a sheet matching the report's name does not exist, it will be created by the add-on.
Reset: Clears all current fields to start a new configuration from scratch.
Run all stored reports
You can run all reports from the "Reports configuration" sheet using the Run reports option from the add-on menu. A new sheet is created for each report configuration and updated every time the report is run.