Page Summary
-
The Google Visualization Data Source Library simplifies creating visualization data sources by implementing the Google Visualization API protocol and query language.
-
You primarily write code to provide data to the library as a two-dimensional data table.
-
Abstract classes and helper functions are available to assist in writing your implementation code.
-
The library can serve both static data defined within your code and data from external data stores like files or databases.
-
The process involves the library handling the query, your code providing the data table, the library executing the query, and the library rendering the response.
The Google Visualization Data Source Library makes it easy to create a visualization data source. The library implements the Google Visualization API wire protocol and query language. You write only the code that is required to make your data available to the library in the form of a data table. A data table is a two-dimensional table of values where every column is of a single type. Writing the code that you need is made easier by the provision of abstract classes and helper functions.
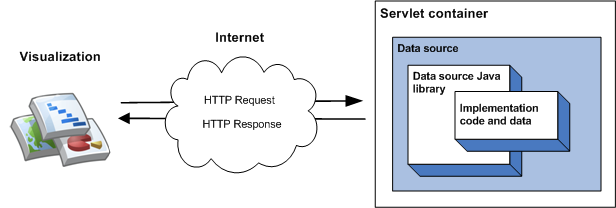
The simplest implementation of the library involves inheriting from a single class, implementing a member function and running the data source as a servlet within a servlet container. In the simplest implementation, the following sequence of events takes place when a visualization queries the data source:
- The servlet container handles the query and passes it to the data source Java library.
- The library parses the query.
- The implementation code - the code that you write - returns a data table to the library.
- The library executes the query on the data table.
- The library renders the data table into the response expected by the visualization.
- The servlet container returns the response to the visualization.
This is illustrated in the following diagram:
The Getting Started with Data Sources section describes how to implement this type of data source.
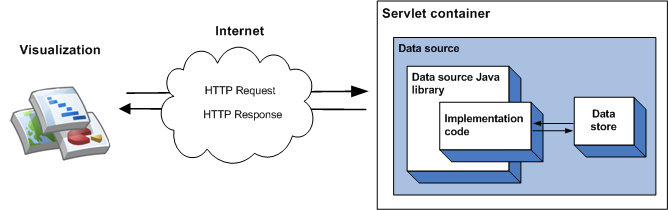
The data that is served by a data source can be specified in your implementation code, which is fine for small amounts of static data. For larger data sets it is more likely you will need to use an external data store such as an external file or database. If a data source uses an external data store, the following sequence of events takes place when a visualization queries the data source:
- The servlet container handles the query and passes it to the data source Java library.
- The library parses the query.
- The implementation code - the code you write - reads the data held in the data store and returns a data table to the library. If the data set is large, and the data store has querying capabilities, you can optionally use those capabilities to increase the efficiency of your data source.
- The library executes the query on the data table.
- The library renders the data table into the response expected by the visualization.
- The servlet container returns the response to the visualization.
This is illustrated in the following diagram:
The Using an External Data Store section describes how to implement this type of data source.