使用 Google 圖表
透過集合功能整理內容
你可以依據偏好儲存及分類內容。
Google 圖表可讓您以視覺化方式呈現網站上的資料。從簡單的折線圖到複雜的階層式樹狀圖,圖表庫都提供了大量可用的圖表類型,
使用 Google 圖表的最常見方法就是使用嵌入網頁中的簡易 JavaScript。您載入某些 Google 圖表資料庫、列出要繪製圖表的資料、選取自訂圖表的選項,最後使用您選擇的 id 來建立圖表物件。
然後,在網頁上使用該 id 建立 <div> 以顯示 Google 圖表。
這就是您需要開始使用的步驟。
圖表是以 JavaScript 類別的形式呈現,而 Google 圖表則提供多種圖表類型供您使用。預設外觀通常是您所需要的,您也可以隨時自訂圖表,以符合網站的外觀和風格。圖表具備高度互動性及公開呈現事件,您可以用來連結各種資訊主頁或其他與網頁整合的體驗。圖表採用 HTML5/SVG 技術來呈現,提供跨瀏覽器相容性 (包括舊版 IE 版本的 VML),以及 iPhone、iPad 和 Android 的跨平台可攜性。使用者永遠都無需使用外掛程式或任何軟體。如果他們擁有網路瀏覽器,就可以查看您的圖表。
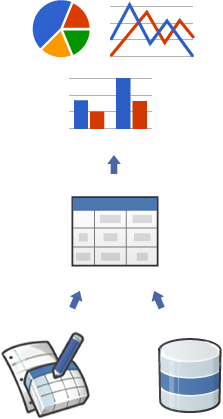
所有圖表類型都會使用 DataTable 類別填入資料,方便您在實驗時輕鬆切換圖表類型,找出理想的外觀。DataTable 提供排序、修改及篩選資料的方法,並可直接從您的網頁、資料庫或任何支援圖表工具資料來源通訊協定的資料供應商填入。(該通訊協定包含類似 SQL 的查詢語言,且是由 Google 試算表、Google Fusion Tables 和 SalesForce 等第三方資料供應商所實作。
您甚至可以在自己的網站上實作通訊協定,並成為其他服務的資料供應商。)
準備好建立第一個圖表了嗎?請參閱快速入門導覽課程。
我們的工具會持續更新,以更滿足您的需求;我們會參考您的意見回饋,決定要優先提供哪些功能。歡迎加入我們的討論群組。
除非另有註明,否則本頁面中的內容是採用創用 CC 姓名標示 4.0 授權,程式碼範例則為阿帕契 2.0 授權。詳情請參閱《Google Developers 網站政策》。Java 是 Oracle 和/或其關聯企業的註冊商標。
上次更新時間:2024-07-10 (世界標準時間)。
[null,null,["上次更新時間:2024-07-10 (世界標準時間)。"],[[["\u003cp\u003eGoogle Charts offers a wide variety of interactive and customizable chart types to visualize data on your website.\u003c/p\u003e\n"],["\u003cp\u003eEmbedding charts is straightforward using simple JavaScript that loads libraries, specifies data, customizes options, and creates a chart object within a div element.\u003c/p\u003e\n"],["\u003cp\u003eCharts are highly interactive, supporting events, dashboards, and integration with web pages for enhanced user experiences.\u003c/p\u003e\n"],["\u003cp\u003eGoogle Charts uses HTML5/SVG technology for cross-browser and cross-platform compatibility, ensuring accessibility for all users.\u003c/p\u003e\n"],["\u003cp\u003eData population is handled by the DataTable class, enabling easy switching between chart types and providing methods for data manipulation and sourcing.\u003c/p\u003e\n"]]],[],null,["# Using Google Charts\n\nGoogle Charts provides a perfect way to visualize data on your website.\nFrom simple line charts to complex hierarchical tree maps, the\n[chart gallery](/chart/interactive/docs/gallery)\nprovides a large number of ready-to-use chart types.\n\nThe most common way to use Google Charts is with simple JavaScript\nthat you embed in your web page. You load some Google Chart libraries,\nlist the data to be charted, select options to customize your chart,\nand finally create a chart object with an id that you choose.\nThen, later in the web page, you create a \\\u003cdiv\\\u003e\nwith that id to display the Google Chart.\n\nThat's all you need to [get started](/chart/interactive/docs/quick_start).\n\nCharts are exposed as JavaScript classes, and Google Charts provides\n[many chart types](/chart/interactive/docs/gallery) for you to use.\nThe default appearance will usually be all you need, and you can always\n[customize a chart](/chart/interactive/docs/customizing_charts)\nto fit the look and feel of your website. Charts are highly interactive and expose\n[events](/chart/interactive/docs/events) that let you connect them to create complex\n[dashboards](/chart/interactive/docs/gallery/controls) or other experiences\n[integrated with your\nwebpage](/chart/interactive/docs/examples#full_html_page_example).\nCharts are rendered using HTML5/SVG technology to provide cross-browser compatibility\n(including VML for older IE versions) and cross platform portability to iPhones,\niPads, and Android. Your users will never have to mess with plugins or any software.\nIf they have a web browser, they can see your charts.\n\nAll chart types are populated with data using the\n[DataTable](/chart/interactive/docs/reference#DataTable) class,\nmaking it easy to switch between chart types as you experiment to find the ideal appearance.\nThe DataTable provides methods for sorting, modifying, and filtering data, and can be\npopulated directly from your web page, a database, or any data provider supporting the\n[Chart Tools Datasource](/chart/interactive/docs/queries) protocol.\n(That protocol includes a SQL-like query language and is implemented by Google Spreadsheets,\nGoogle Fusion Tables and third party data providers such as SalesForce.\nYou can even implement the protocol on your own website and become a data provider\nfor other services.)\n\n**Ready to create your first chart? Visit the\n[quickstart](/chart/interactive/docs/quick_start).**\n\nOur tools are constantly evolving to better address your needs;\nwe depend on your feedback to help us prioritize which features to include.\nJoin our [discussion group](http://groups.google.com/group/google-visualization-api)."]]