使用 Google 图表
使用集合让一切井井有条
根据您的偏好保存内容并对其进行分类。
Google 图表是将您网站上的数据可视化的利器。
从简单的折线图到复杂的分层树形图,图表库提供了大量现成可用的图表类型。
使用 Google 图表的最常见方法是嵌入网页中的简单 JavaScript。您可以加载一些 Google 图表库,列出要绘制图表的数据,选择自定义图表的选项,最后使用您选择的 id 创建图表对象。然后,在该网页中后面的位置创建包含该 id 的 <div> 以显示 Google 图表。
以上就是开始使用的所有信息。
图表以 JavaScript 类的形式公开提供,Google 图表提供许多图表类型供您使用。默认外观通常符合您的需求,您可以随时自定义图表,使其与您网站的外观和风格相称。图表是高度互动的,可显示事件,从而使您能够创建复杂的信息中心或其他与网页集成的体验。
图表使用 HTML5/SVG 技术呈现,以提供跨浏览器兼容性(包括适用于旧版 IE 的 VML),以及跨平台兼容 iPhone、iPad 和 Android 平台。您的用户永远不必处理插件或任何软件。
如果他们有网络浏览器,则可以看到您的图表。
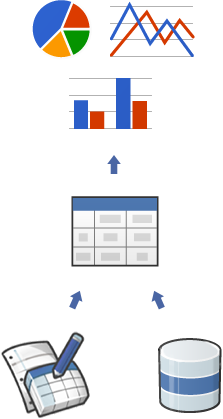
所有图表类型都会使用 DataTable 类填充数据,因此,当您进行实验以找到理想的外观时,您可以轻松地在图表类型之间切换。
DataTable 提供了排序、修改和过滤数据的方法,可以直接从您的网页、数据库或支持 Chart Tools Datasource 协议的任何数据提供商填充。
(该协议包含类似 SQL 的查询语言,由 Google 电子表格、Google Fusion Tables 和第三方数据提供商(如 SalesForce)实现。您甚至可以在自己的网站上实现该协议,并成为其他服务的数据提供商。)
准备好创建您的第一个图表了吗?请参阅快速入门。
我们的工具会不断改进,以便更好地满足您的需求;我们期待您的反馈,以帮助我们确定应优先添加哪些功能。
加入我们的论坛。
如未另行说明,那么本页面中的内容已根据知识共享署名 4.0 许可获得了许可,并且代码示例已根据 Apache 2.0 许可获得了许可。有关详情,请参阅 Google 开发者网站政策。Java 是 Oracle 和/或其关联公司的注册商标。
最后更新时间 (UTC):2024-07-10。
[null,null,["最后更新时间 (UTC):2024-07-10。"],[[["\u003cp\u003eGoogle Charts offers a wide variety of interactive and customizable chart types to visualize data on your website.\u003c/p\u003e\n"],["\u003cp\u003eEmbedding charts is straightforward using simple JavaScript that loads libraries, specifies data, customizes options, and creates a chart object within a div element.\u003c/p\u003e\n"],["\u003cp\u003eCharts are highly interactive, supporting events, dashboards, and integration with web pages for enhanced user experiences.\u003c/p\u003e\n"],["\u003cp\u003eGoogle Charts uses HTML5/SVG technology for cross-browser and cross-platform compatibility, ensuring accessibility for all users.\u003c/p\u003e\n"],["\u003cp\u003eData population is handled by the DataTable class, enabling easy switching between chart types and providing methods for data manipulation and sourcing.\u003c/p\u003e\n"]]],[],null,["# Using Google Charts\n\nGoogle Charts provides a perfect way to visualize data on your website.\nFrom simple line charts to complex hierarchical tree maps, the\n[chart gallery](/chart/interactive/docs/gallery)\nprovides a large number of ready-to-use chart types.\n\nThe most common way to use Google Charts is with simple JavaScript\nthat you embed in your web page. You load some Google Chart libraries,\nlist the data to be charted, select options to customize your chart,\nand finally create a chart object with an id that you choose.\nThen, later in the web page, you create a \\\u003cdiv\\\u003e\nwith that id to display the Google Chart.\n\nThat's all you need to [get started](/chart/interactive/docs/quick_start).\n\nCharts are exposed as JavaScript classes, and Google Charts provides\n[many chart types](/chart/interactive/docs/gallery) for you to use.\nThe default appearance will usually be all you need, and you can always\n[customize a chart](/chart/interactive/docs/customizing_charts)\nto fit the look and feel of your website. Charts are highly interactive and expose\n[events](/chart/interactive/docs/events) that let you connect them to create complex\n[dashboards](/chart/interactive/docs/gallery/controls) or other experiences\n[integrated with your\nwebpage](/chart/interactive/docs/examples#full_html_page_example).\nCharts are rendered using HTML5/SVG technology to provide cross-browser compatibility\n(including VML for older IE versions) and cross platform portability to iPhones,\niPads, and Android. Your users will never have to mess with plugins or any software.\nIf they have a web browser, they can see your charts.\n\nAll chart types are populated with data using the\n[DataTable](/chart/interactive/docs/reference#DataTable) class,\nmaking it easy to switch between chart types as you experiment to find the ideal appearance.\nThe DataTable provides methods for sorting, modifying, and filtering data, and can be\npopulated directly from your web page, a database, or any data provider supporting the\n[Chart Tools Datasource](/chart/interactive/docs/queries) protocol.\n(That protocol includes a SQL-like query language and is implemented by Google Spreadsheets,\nGoogle Fusion Tables and third party data providers such as SalesForce.\nYou can even implement the protocol on your own website and become a data provider\nfor other services.)\n\n**Ready to create your first chart? Visit the\n[quickstart](/chart/interactive/docs/quick_start).**\n\nOur tools are constantly evolving to better address your needs;\nwe depend on your feedback to help us prioritize which features to include.\nJoin our [discussion group](http://groups.google.com/group/google-visualization-api)."]]