- 利用可能なデータセットの期間
- 2016-06-22T12:00:00Z–2026-06-12T12:00:00Z
- データセット プロデューサー
- 欧州中期予報センター(ECMWF)
- 回転数
- 1 日
- タグ
説明
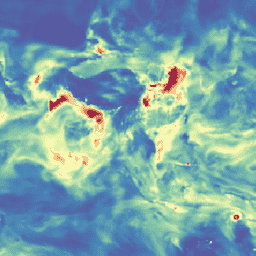
Copernicus 大気監視サービスは、地球の大気の組成をグローバル スケールとリージョン スケールで継続的にモニタリングする機能を提供します。主なグローバル準リアルタイム生成システムは、データ同化と予測のスイートで、化学スキームの一部であるエアロゾルと化学物質について 1 日あたり 2 回、5 日間の予測を提供します。
2021 年 7 月 1 日より前は、次の 2 つのパラメータのみが使用可能でした。 1. 550 nm の地表におけるエアロゾル全光学的厚さ 2. 粒子状物質 d < 25 um の地表。system:time_start は予測時間を指します。
バンド
バンド
ピクセルサイズ: 44,528 メートル(すべてのバンド)
| 名前 | 単位 | 最小 | 最大 | ピクセルサイズ | 説明 |
|---|---|---|---|---|---|
total_aerosol_optical_depth_at_550nm_surface |
9.6e-05* | 3.58255* | 44,528 メートル | 550 nm におけるエアロゾル全光学的厚さ |
|
particulate_matter_d_less_than_25_um_surface |
kg/m^3 | 0* | 7.6e-05* | 44,528 メートル | 粒子状物質 d < 2.5 um |
total_column_nitrogen_dioxide_surface |
kg/m^2 | 44,528 メートル | 二酸化窒素の地表における総カラム |
||
total_column_sulphur_dioxide_surface |
kg/m^2 | 44,528 メートル | 二酸化硫黄の地表における総カラム |
||
total_column_carbon_monoxide_surface |
kg/m^2 | 44,528 メートル | 一酸化炭素の地表における総カラム |
||
total_column_formaldehyde_surface |
kg/m^2 | 44,528 メートル | ホルムアルデヒドの地表における総カラム |
||
gems_total_column_ozone_surface |
44,528 メートル | Gems オゾンの地表における総カラム |
|||
sea_salt_aerosol_optical_depth_at_550nm_surface |
44,528 メートル | 550 nm における海塩エアロゾルの光学的厚さの地表 |
|||
dust_aerosol_optical_depth_at_550nm_surface |
44,528 メートル | 550 nm におけるダスト エアロゾルの光学的厚さの地表 |
|||
organic_matter_aerosol_optical_depth_at_550nm_surface |
44,528 メートル | 550 nm における有機物エアロゾルの光学的厚さの地表 |
|||
black_carbon_aerosol_optical_depth_at_550nm_surface |
44,528 メートル | 550 nm における黒色炭素エアロゾルの光学的厚さの地表 |
|||
sulphate_aerosol_optical_depth_at_550nm_surface |
44,528 メートル | 550 nm における硫酸塩エアロゾルの光学的厚さの地表 |
|||
total_aerosol_optical_depth_at_469nm_surface |
44,528 メートル | 469 nm におけるエアロゾル全光学的厚さの地表 |
|||
total_aerosol_optical_depth_at_670nm_surface |
44,528 メートル | 670 nm におけるエアロゾル全光学的厚さの地表 |
|||
total_aerosol_optical_depth_at_865nm_surface |
44,528 メートル | 865 nm におけるエアロゾル全光学的厚さの地表 |
|||
total_aerosol_optical_depth_at_1240nm_surface |
44,528 メートル | 1240 nm におけるエアロゾル全光学的厚さの地表 |
|||
var98-0-210-250_surface |
44,528 メートル | 550 nm における硝酸塩エアロゾルの光学的厚さ |
|||
var98-0-210-251_surface |
44,528 メートル | 550 nm におけるアンモニウム エアロゾルの光学的厚さ |
|||
particulate_matter_d_less_than_1_um_surface |
kg/m^3 | 44,528 メートル | 粒子状物質 d < 1 um の地表 |
||
particulate_matter_d_less_than_10_um_surface |
kg/m^3 | 44,528 メートル | 粒子状物質 d < 10 um の地表 |
||
uv_biologically_effective_dose_surface |
W/m^2 | 44,528 メートル | UV 生物学的有効線量の地表 |
||
total_column__peroxyacetyl_nitrate_surface |
kg/m^2 | 44,528 メートル | ペルオキシアセチルナイトレートの地表における総カラム |
||
total_column__isoprene_surface |
kg/m^2 | 44,528 メートル | イソプレンの地表における総カラム |
||
total_column_nitrogen_monoxide_surface |
kg/m^2 | 44,528 メートル | 一酸化窒素の地表における総カラム |
||
total_column_hydrogen_peroxide_surface |
kg/m^2 | 44,528 メートル | 過酸化水素の地表における総カラム |
||
total_column_hydroxyl_radical_surface |
kg/m^2 | 44,528 メートル | ヒドロキシルラジカルの地表における総カラム |
||
total_column_methane_surface |
kg/m^2 | 44,528 メートル | メタンの地表における総カラム |
||
total_column__ethane_surface |
44,528 メートル | エタンの地表における総カラム |
|||
total_column_propane_surface |
kg/m^2 | 44,528 メートル | プロパンの地表における総カラム |
||
total_column_nitric_acid_surface |
kg/m^2 | 44,528 メートル | 硝酸の地表における総カラム |
画像プロパティ検出
画像プロパティ検出
| 名前 | タイプ | 説明 |
|---|---|---|
| model_initialization_hour | INT | プロダクトの作成時間 |
| model_initialization_datetime | STRING | プロダクトの作成日時 |
| model_forecast_hour | INT | プロダクトの予測時間 |
利用規約
利用規約
商用目的または非商用目的で、改変の有無にかかわらず、使用、複製、再配布に制限はありません。このデータ ポリシーは、Copernicus プログラム内で生成されたデータと情報( Sentinel ミッション データと Copernicus サービス情報)に適用されます。
COPERNICUS データ ライセンスの 全文をご覧ください。
帰属要件を含むライセンス条項を以下に示します。
5.1.1. ライセンシーが Copernicus プロダクトを一般に伝達または配布する場合、ライセンシーは次の通知または同様の通知を使用して、ソースを受信者に通知するものとします。
- 「Copernicus Climate Change Service の情報 [年] を使用して生成」
- 「Copernicus Atmosphere Monitoring Service の情報 [年] を使用して生成」
5.1.2. ライセンシーが、改変または修正された Copernicus プロダクトを含む出版物または配布物を作成または提供する場合、ライセンシーは次の通知または同様の通知を提供するものとします。
- 「Copernicus Climate Change Service の情報 [年] を修正したものが含まれています」
- 「Copernicus Atmosphere Monitoring Service の情報 [年] を修正したものが含まれています」
5.1.3. 条項 5.1.1 と
5.1.2 に該当する出版物または配布物には、欧州委員会および ECMWF は、Copernicus の情報またはそこに含まれるデータから生じるいかなる使用に対しても責任を負わないことを明記するものとします。
引用
Benedetti, A. 他、2009 年: Aerosol analysis and forecast in the ECMWF Integrated Forecast System. Part II : Data assimilation, J. Geophys. Res., 114, D13205 doi:10.1029/2008JD011115.
Morcrette 他、2009 年: Aerosol analysis and forecast in the ECMWF Integrated Forecast System. Part I: Forward modelling, J. Geophys. Res., 114, D06206. doi:10.1029/2008JD011235
DOI
Earth Engine で探索
コードエディタ(JavaScript)
// Get data generated from model hour 0 for January 1st, 2019.
var dataset = ee.ImageCollection('ECMWF/CAMS/NRT')
                  .filterDate('2019-01-01', '2019-01-02')
                  .filter('model_initialization_hour == 0');

// Select first and last forecast hours.
var hour00 = dataset.filter('model_forecast_hour == 0').first();
var hour21 = dataset.filter('model_forecast_hour == 21').first();

// Visualization parameters for specified aerosol band.
var visParams = {
  bands: ['total_aerosol_optical_depth_at_550nm_surface'],
  min: 0.0,
  max: 3.6,
  palette: [
    '5e4fa2', '3288bd', '66c2a5', 'abe0a4', 'e6f598', 'ffffbf',
    'fee08b', 'fdae61', 'f46d43', 'd53e4f', '9e0142'
  ]
};

// Display forecasts on the map.
Map.setCenter(70, 45, 3);
Map.addLayer(hour00, visParams, 'Total Aerosal Optical Depth - H00', true, 0.8);
Map.addLayer(hour21, visParams, 'Total Aerosal Optical Depth - H21', true, 0.8);