- Dostępność zbioru danych
- 2021-07-30T00:00:00Z–2023-10-13T00:00:00Z
- Dostawca zbioru danych
- Environmental Defense Fund – MethaneSAT
- Tagi
Opis
Model emisji w danym obszarze jest w fazie rozwoju i nie odzwierciedla produktu końcowego.
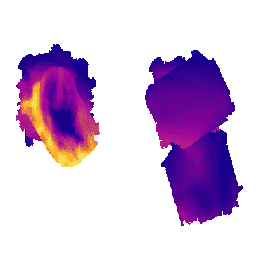
Ten zbiór danych zawiera przestrzennie rozdzielone strumienie emisji metanu (kg/godz.) na podstawie pomiarów z lotów MethaneAIR, które koncentrują się na regionach wydobycia ropy naftowej i gazu ziemnego w Stanach Zjednoczonych. Całkowitą emisję na obszarze badania uzyskuje się przez zsumowanie wartości pikseli.
Metan to silny gaz cieplarniany, który w ciągu pierwszych 20 lat po przedostaniu się do atmosfery ma ponad 80 razy większy potencjał ocieplenia niż dwutlenek węgla. Co najmniej 30% obecnego globalnego ocieplenia jest spowodowane metanem pochodzącym z działalności człowieka. Ograniczenie emisji metanu związanej z działalnością człowieka – w tym możliwych do uniknięcia emisji z operacji naftowych i gazowych, rolnictwa i gospodarki odpadami – to najszybszy sposób na spowolnienie tempa globalnego ocieplenia.
Emisje z obszaru są szacowane na podstawie zaobserwowanych wartości XCH4 przy użyciu geostatystycznego modelu odwrotnego (zobacz zbiór danych „MethaneAIR L4 Area Sources”). Model transportu atmosferycznego – stochastyczny model transportu lagranżowskiego z odwróceniem czasu „STILT” (Lin i in. 2003, Fasoli i in. 2018) – oparty na danych meteorologicznych z modelu NOAA High-Resolution Rapid Refresh Model „HRRR” służy do powiązania zmian obserwowanych wartości XCH4 z potencjalnymi źródłami po stronie nawietrznej. Stosujemy podejście hierarchiczne, aby oddzielić zmiany XCH4 wynikające z emisji obszarowych od zmian wynikających z emisji ze źródeł punktowych lub napływu przez granicę domeny (stężenie „tła”). Emisje ze źródeł punktowych są określane indywidualnie (patrz zbiór danych „MethaneAIR L4 Point Sources”) i wcześniej odejmowane od zaobserwowanego XCH4. Następnie do oszacowania dopływu XCH4 w domenie granicznej używany jest model odwrotny. Na koniec emisje obszarowe są szacowane za pomocą geostatystycznego modelu odwrotnego z wymuszonym rozwiązaniem nieujemnym. Łączna emisja to suma emisji z obszarów i źródeł punktowych.
Ten zbiór danych został wygenerowany na podstawie pomiarów MethaneAIR wykonanych podczas lotów między 30 lipca 2021 r. a 13 października 2023 r. MethaneAIR to powietrzny prekursor misji satelitarnej MethaneSAT, zarządzanej przez MethaneSAT LLC, podmiot zależny w całości należący do Environmental Defense Fund. Strumienie emisji metanu zostały wygenerowane przy użyciu geostatystycznego modelu odwrotnego, który jest wyspecjalizowany w wykorzystywaniu wysokiej rozdzielczości przestrzennej, szerokiego zasięgu przestrzennego i wysokiej precyzji danych MethaneAIR. Nie wszystkie produkty danych są dostępne w przypadku wszystkich lotów.
Więcej informacji o przyrządzie MethaneAIR, jego kalibracji i wykrywaniu emisji znajdziesz w ostatnich publikacjach Loughner i in. (2021), Staebell i in. (2021), Conway i in. (2023), Chulakadabba i in. (2023), Abbadi i in. (2023), Omara i in. (2023) oraz Miller i in. (2023).
Więcej informacji o projekcie możesz uzyskać od dostawcy danych, klikając ten link: https://www.methanesat.org/contact/
Pasma
Pasma
Rozmiar piksela: 1000 m (wszystkie pasma)
| Nazwa | Jednostki | Min. | Maks. | Rozmiar piksela | Opis |
|---|---|---|---|---|---|
flux |
kg/h/km^2 | 0* | 28,3* | 1 000 metrów | Emisje metanu możliwe do przypisania do obszaru o powierzchni 1 km². |
Właściwości obrazu
Właściwości obrazu
| Nazwa | Typ | Opis |
|---|---|---|
| flight_id | CIĄG ZNAKÓW | Wyszukaj numer lotu. |
| Basin | CIĄG ZNAKÓW | Basen naftowy i gazowy (np. Permian) lub obszar zainteresowania (np. Nowy Jork). |
| time_coverage_start | CIĄG ZNAKÓW | Czas rozpoczęcia zbierania danych w formacie RRRR-MM-DDThh:mm:ssZ (ISO 8601). |
| time_coverage_end | CIĄG ZNAKÓW | Czas zakończenia zbierania danych w formacie RRRR-MM-DDThh:mm:ssZ (ISO 8601). |
| processing_id | CIĄG ZNAKÓW | (wewnętrzny) Identyfikator przebiegu przetwarzania, który reprezentuje obliczenia, które doprowadziły do powstania cech. Nie jest to atrybut opisujący lot, ale potok przetwarzania. |
| area_source_total_kg_hr | PRZ | Łączna wartość emisji obszarowych dla tego lotu w kg/godz. Brakujące wartości są oznaczone jako -1. |
Warunki korzystania z usługi
Warunki korzystania z usługi
Korzystanie z tych danych podlega Warunkom licencji na treści MethaneSAT.
Cytaty
Chulakadabba, A., Sargent, M., Lauvaux, T., Benmergui, J. S., Franklin, J. E., Chan Miller, C., Wilzewski, J. S., Roche, S., Conway, E., Souri, A. H., Sun, K., Luo, B., Hawthrone, J., Samra, J., Daube, B. C., Liu, X., Chance, K., Li, Y., Gautam, R., Omara, M., Rutherford, J. S., Sherwin, E. D., Brandt, A., and Wofsy, S. C. 2023 r. Methane point source quantification using MethaneAIR: a new airborne imaging spectrometer, Atmos. Meas. Tech., 16, 5771-5785. doi:10.5194/amt-16-5771-2023,
Odkrywaj za pomocą Earth Engine
Edytor kodu (JavaScript)
var dataset = ee.ImageCollection("EDF/MethaneSAT/MethaneAIR/L4area");

var fluxVisParams = {
  min: 0,
  max: 18,
  palette: ['#070088','#a3069b','#cc4e64','#ffa826','#edfb59'],
};

// Center on one of the available areas of interests.
Map.setCenter(-102.5, 31.85, 8);
Map.addLayer(dataset, fluxVisParams, 'Methane area sources flux');