Модель выбросов на данной территории все еще находится в стадии разработки и не является репрезентативной для конечного продукта.
Этот набор данных содержит пространственно дезагрегированные данные о потоках выбросов метана (кг/ч), полученные на основе измерений, полученных с помощью MethaneAIR в районах добычи нефти и газа по всей территории США. Общий объём выбросов в исследуемой области рассчитывается путём суммирования значений пикселей.
Метан — мощный парниковый газ, чья способность к согреванию в течение первых 20 лет после попадания в атмосферу более чем в 80 раз превышает способность углекислого газа. Как минимум 30% сегодняшнего глобального потепления обусловлено метаном, образующимся в результате деятельности человека. Сокращение выбросов метана, связанных с деятельностью человека, включая предотвратимые выбросы от добычи нефти и газа, сельского хозяйства и утилизации отходов, — это самый быстрый способ замедлить темпы глобального потепления.
Выбросы на площади оцениваются на основе наблюдаемых значений XCH4 с использованием геостатистической модели обратной модели (см. набор данных «MethaneAIR L4 Area Sources» ). Модель атмосферного переноса — стохастическая лагранжева модель переноса с обратным временем «STILT»; Лин и др. (2003) , Фасоли и др. (2018) ; основанная на метеорологических данных из модели быстрого обновления высокого разрешения NOAA «HRRR», — используется для связи изменений наблюдаемых значений XCH4 с потенциальными источниками против ветра. Иерархический подход используется для разделения изменений XCH4, вызванных выбросами на площади, от изменений, вызванных выбросами из точечных источников или притоком через границу домена («фоновая» концентрация). Выбросы из точечных источников определяются индивидуально (см. набор данных «MethaneAIR L4 Point Sources» ) и предварительно вычитаются из наблюдаемого XCH4. Затем обратная модель используется для оценки притока XCH4 через границу домена. Наконец, площадные выбросы оцениваются с помощью геостатистической обратной модели с обязательным неотрицательным решением. Общие выбросы представляют собой сумму площадных и точечных выбросов.
Этот набор данных был создан на основе измерений MethaneAIR, проведенных во время полетов с 30 июля 2021 года по 13 октября 2023 года. MethaneAIR — это бортовой предшественник спутниковой миссии MethaneSAT, управляемый компанией MethaneSAT LLC , дочерней компанией Environmental Defense Fund. Потоки выбросов метана были получены с помощью геостатистической платформы обратного моделирования, специально разработанной для использования высокого пространственного разрешения, широкого пространственного охвата и высокой точности данных MethaneAIR. Не все продукты данных доступны для всех полетов.
Нефтегазовый бассейн (например, Пермский) или интересующая область (например, Нью-Йорк).
время_покрытия_начала
НИТЬ
Время начала сбора данных в формате ГГГГ-ММ-ДДTчч:мм:ссZ STRING (ISO 8601).
время_покрытия_конец
НИТЬ
Время окончания сбора данных в формате ГГГГ-ММ-ДДTчч:мм:ссZ STRING (ISO 8601).
processing_id
НИТЬ
(внутренний) Идентификатор процесса обработки, представляющий вычисления, приведшие к появлению этих признаков. Это не атрибут, описывающий сам рейс, а конвейер обработки.
площадь_источника_всего_кг_ч
ИНТ
Суммарное значение выбросов в данном районе для данного рейса в кг/ч. Отсутствующие значения обозначены знаком -1.
Chulakadabba, A., Sargent, M., Lauvaux, T., Benmergui, JS, Franklin, JE, Chan Miller, C., Wilzewski, JS, Roche, S., Conway, E., Souri, AH, Sun, K., Luo, B., Hawthrone, J., Samra, J., Daube, BC, Liu, X., Chance, K., Li, Y., Gautam, R., Omara, M., Rutherford, JS, Sherwin, ED, Brandt, A. и Wofsy, SC 2023. Количественная оценка точечных источников метана с использованием MethaneAIR: новый спектрометр для получения изображений на борту самолета, Atmos. Meas. Tech., 16, 5771-5785. doi:10.5194/amt-16-5771-2023 ,
Модель выбросов по области всё ещё находится в стадии разработки и не является репрезентативной для конечного продукта. Этот набор данных содержит пространственно дезагрегированные потоки выбросов метана (кг/ч), полученные на основе измерений, полученных в ходе полётов MethaneAIR в нефтегазодобывающие регионы по всей территории США. Суммарные выбросы по исследуемой области получены путём суммирования…
[null,null,[],[[["\u003cp\u003eThis dataset presents spatially disaggregated methane emission fluxes (kg/hr) derived from MethaneAIR flights over oil and gas production areas in the United States, with total emissions calculated by summing pixel values.\u003c/p\u003e\n"],["\u003cp\u003eThe dataset utilizes a geostatistical inverse model framework and atmospheric transport modeling to estimate methane emissions, differentiating between area, point, and background sources.\u003c/p\u003e\n"],["\u003cp\u003eDeveloped by Environmental Defense Fund, this dataset, covering July 2021 to October 2023, represents a preliminary area emissions model and is not a final product.\u003c/p\u003e\n"],["\u003cp\u003eUsers can access and analyze this data through Google Earth Engine, with further information available on the MethaneSAT website and relevant publications.\u003c/p\u003e\n"],["\u003cp\u003eThe data is subject to MethaneSAT's Content License Terms of Use and includes bands for methane flux and image properties like flight ID, basin, and total emissions.\u003c/p\u003e\n"]]],[],null,["# MethaneAIR L4 Area Sources v1\n\nDataset Availability\n: 2021-07-30T00:00:00Z--2023-10-13T00:00:00Z\n\nDataset Provider\n:\n\n\n [Environmental Defense Fund - MethaneSAT](https://methanesat.org)\n\nTags\n:\n[atmosphere](/earth-engine/datasets/tags/atmosphere) [climate](/earth-engine/datasets/tags/climate) [edf](/earth-engine/datasets/tags/edf) [emissions](/earth-engine/datasets/tags/emissions) [ghg](/earth-engine/datasets/tags/ghg) [methane](/earth-engine/datasets/tags/methane) [methaneair](/earth-engine/datasets/tags/methaneair) [methanesat](/earth-engine/datasets/tags/methanesat) \n\n#### Description\n\n**The area emissions model is still in development and not representative of\na final product.**\n\nThis dataset provides spatially disaggregated methane emission fluxes\n(kg/hr) using measurements from MethaneAIR flights focused on oil and gas\nproducing regions throughout the United States. Total emissions for the\nsurvey area are obtained by summing the pixel values.\n\nMethane is a potent greenhouse gas that has more than 80 times the warming power\nof carbon dioxide over the first 20 years after it reaches the atmosphere. At\nleast 30% of today's global warming is driven by methane from human actions.\nCutting methane emissions associated with human activities - including avoidable\nemissions from oil and gas operations, agriculture, and waste management - is\nthe single fastest way to slow the rate of global warming.\n\nArea emissions are estimated from observed XCH4 using a geostatistical inverse\nmodel framework (see [\"MethaneAIR L4 Area Sources\"](/earth-engine/datasets/catalog/EDF_MethaneSAT_MethaneAIR_L4area) dataset). An atmospheric transport model -\nthe Stochastic Time-Inverted Lagrangian Transport model, \"STILT\";\n[Lin et al. (2003)](https://doi.org/10.1029/2002JD003161),\n[Fasoli et al. (2018)](https://doi.org/10.5194/gmd-11-2813-2018); driven by\nmeteorological data from the NOAA High-Resolution Rapid Refresh Model \"HRRR\" -\nis used to link variations in observed XCH4 to potential upwind sources. A\nhierarchical approach is used to separate XCH4 variations due to area emissions\nfrom those due to point source emissions or inflow across the domain boundary\n(the \"background\" concentration). Point source emissions are determined\nindividually (see [\"MethaneAIR L4 Point Sources\"](/earth-engine/datasets/catalog/EDF_MethaneSAT_MethaneAIR_L4point) dataset) and pre-subtracted from the observed XCH4. An inverse model is then\nused to estimate XCH4 inflow across the boundary domain. Finally, area emissions\nare estimated using a geostatistical inverse model with an enforced non-negative solution. Total emissions are the sum of area and point source emissions.\n\nThis dataset was generated using MethaneAIR measurements taken on flights\nbetween 30 July 2021 and 13 October 2023. MethaneAIR is an airborne precursor of\nthe MethaneSAT satellite mission, managed by [MethaneSAT LLC](https://www.methanesat.org/),\na wholly owned subsidiary of Environmental Defense Fund. The methane emission fluxes were produced using a geostatistical inverse\nmodeling framework specialized to exploit the high spatial resolution, wide\nspatial coverage, and high precision of MethaneAIR data. Not all data\nproducts are available for all flights.\n\nFor additional information about the MethaneAIR instrument, instrument\ncalibration and emission detections, please refer to recent publications by\n[Loughner et al. (2021)](https://doi.org/10.1175/JAMC-D-20-0158.1),\n[Staebell et al. (2021)](https://doi.org/10.5194/amt-14-3737-2021),\n[Conway et al. (2023)](https://doi.org/10.5194/amt-2023-111),\n[Chulakadabba et al. (2023)](https://doi.org/10.5194/egusphere-2023-822),\n[Abbadi et al. (2023)](https://doi.org/10.31223/X51D4C),\n[Omara et al. (2023)](https://doi.org/10.5194/essd-15-3761-2023),\nand [Miller et al. (2023)](https://doi.org/10.5194/egusphere-2023-1962).\n\nContact the data provider for more information about the project at this\nlink: \u003chttps://www.methanesat.org/contact/\u003e\n\n### Bands\n\n**Bands**\n\n| Name | Units | Min | Max | Pixel Size | Description |\n|--------|------------|-----|--------|-------------|-----------------------------------------------|\n| `flux` | kg/h/km\\^2 | 0\\* | 28.3\\* | 1000 meters | Methane emissions traceable to a 1km\\^2 area. |\n\n\\* estimated min or max value\n\n### Image Properties\n\n**Image Properties**\n\n| Name | Type | Description |\n|-------------------------|--------|----------------------------------------------------------------------------------------------------------------------------------------------------------------------------|\n| flight_id | STRING | Research flight number. |\n| basin | STRING | Oil and Gas basin (e.g. Permian) or area of interest (e.g. New York City). |\n| time_coverage_start | STRING | Data collection start time in YYYY-MM-DDThh:mm:ssZ format STRING (ISO 8601). |\n| time_coverage_end | STRING | Data collection end time in YYYY-MM-DDThh:mm:ssZ format STRING (ISO 8601). |\n| processing_id | STRING | (internal) Processing run identifier that represents the calculations that led to the features. It is not an attribute describing the flight, but the processing pipeline. |\n| area_source_total_kg_hr | INT | Total value of area emissions for this flight in kg/hr. Missing values are indicated by -1. |\n\n### Terms of Use\n\n**Terms of Use**\n\nUse of this data is subject to [MethaneSAT's Content License Terms of\nUse](https://www.methanesat.org/sites/default/files/2025-02/MethaneSAT%20-%20Content%20License%20Terms%20of%20Use%20%28Revised%202-12-2025%29%5B25%5D.pdf).\n\n### Citations\n\nCitations:\n\n- Chulakadabba, A., Sargent, M., Lauvaux, T., Benmergui, J. S., Franklin, J.\n E., Chan Miller, C., Wilzewski, J. S., Roche, S., Conway, E., Souri, A. H.,\n Sun, K., Luo, B., Hawthrone, J., Samra, J., Daube, B. C., Liu, X., Chance,\n K., Li, Y., Gautam, R., Omara, M., Rutherford, J. S., Sherwin, E. D.,\n Brandt, A., and Wofsy, S. C. 2023. Methane point source quantification using\n MethaneAIR: a new airborne imaging spectrometer, Atmos. Meas. Tech., 16,\n 5771-5785.\n [doi:10.5194/amt-16-5771-2023](https://doi.org/10.5194/amt-16-5771-2023),\n\n### Explore with Earth Engine\n\n| **Important:** Earth Engine is a platform for petabyte-scale scientific analysis and visualization of geospatial datasets, both for public benefit and for business and government users. Earth Engine is free to use for research, education, and nonprofit use. To get started, please [register for Earth Engine access.](https://console.cloud.google.com/earth-engine)\n\n### Code Editor (JavaScript)\n\n```javascript\nvar dataset = ee.ImageCollection(\"EDF/MethaneSAT/MethaneAIR/L4area\");\n\nvar fluxVisParams = {\n min: 0,\n max: 18,\n palette: ['#070088','#a3069b','#cc4e64','#ffa826','#edfb59'],\n};\n\n// Center on one of the available areas of interests.\nMap.setCenter(-102.5, 31.85, 8);\nMap.addLayer(dataset, fluxVisParams, 'Methane area sources flux');\n```\n[Open in Code Editor](https://code.earthengine.google.com/?scriptPath=Examples:Datasets/EDF/EDF_MethaneSAT_MethaneAIR_L4area) \n[MethaneAIR L4 Area Sources v1](/earth-engine/datasets/catalog/EDF_MethaneSAT_MethaneAIR_L4area) \nThe area emissions model is still in development and not representative of a final product. 
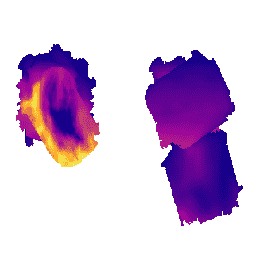
This dataset provides spatially disaggregated methane emission fluxes (kg/hr) using measurements from MethaneAIR flights focused on oil and gas producing regions throughout the United States. Total emissions for the survey area are obtained by summing ... \nEDF/MethaneSAT/MethaneAIR/L4area, atmosphere,climate,edf,emissions,ghg,methane,methaneair,methanesat \n2021-07-30T00:00:00Z/2023-10-13T00:00:00Z \n27.8 -112.56 43.14 -73.45 \nGoogle Earth Engine \nhttps://developers.google.com/earth-engine/datasets\n\n- [](https://doi.org/https://methanesat.org)\n- [](https://doi.org/https://developers.google.com/earth-engine/datasets/catalog/EDF_MethaneSAT_MethaneAIR_L4area)"]]