- Disponibilidad del conjunto de datos
- 2018-01-01T00:00:00Z–2021-11-28T00:00:00Z
- Proveedor de conjuntos de datos
- Global Change Observation Mission (GCOM)
- Cadencia
- 1 día
- Etiquetas
Descripción
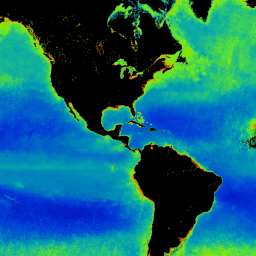
Este producto representa la concentración del pigmento fotosintético (clorofila a) en el fitoplancton de la capa superficial del mar.
Para obtener datos posteriores al 28/11/2021, consulta el conjunto de datos de la versión 3.
El GCOM-C realiza observaciones y recopila datos globales de forma continua y a largo plazo para dilucidar el mecanismo detrás de las fluctuaciones en el presupuesto de radiación y el ciclo del carbono necesarios para hacer proyecciones precisas sobre el aumento futuro de la temperatura. Al mismo tiempo, la cooperación con instituciones de investigación que tienen un modelo numérico climático contribuye a reducir los errores en la predicción del aumento de la temperatura derivada del modelo numérico climático y a mejorar la precisión de la predicción de diversos cambios ambientales. El SGLI instalado en el GCOM-C es el sensor sucesor del Global Imager (GLI) instalado en el ADEOS-II (MIDORI II) y es el radiómetro de imágenes que mide la radiación desde la región del infrarrojo cercano al infrarrojo térmico (380 nm a 12 μm) en 19 canales. La observación global una vez cada dos días aproximadamente es posible en latitudes medias cerca de Japón con un ancho de observación en tierra superior a 1,000 km. Además, el SGLI ofrece una resolución más alta que el sensor global similar y tiene una función de observación polarizada y una función de observación multiángulo.
Bandas
Tamaño del píxel
4638.3 metros
Bandas
| Nombre | Unidades | Mín. | Máx. | Tamaño de los píxeles | Descripción | ||||||||||||||||||||||||||||||||||||||||||||||||||||||||||||||||||||||||||||||||||||||||||||||
|---|---|---|---|---|---|---|---|---|---|---|---|---|---|---|---|---|---|---|---|---|---|---|---|---|---|---|---|---|---|---|---|---|---|---|---|---|---|---|---|---|---|---|---|---|---|---|---|---|---|---|---|---|---|---|---|---|---|---|---|---|---|---|---|---|---|---|---|---|---|---|---|---|---|---|---|---|---|---|---|---|---|---|---|---|---|---|---|---|---|---|---|---|---|---|---|---|---|---|---|
CHLA_AVE |
mg/m³ | 0* | 4,000* | metros | Concentración del pigmento verde (clorofila-a) en el fitoplancton de la capa superficial del mar. |
||||||||||||||||||||||||||||||||||||||||||||||||||||||||||||||||||||||||||||||||||||||||||||||
CHLA_QA_flag |
metros | CHLA QA |
|||||||||||||||||||||||||||||||||||||||||||||||||||||||||||||||||||||||||||||||||||||||||||||||||
Propiedades de imágenes
Propiedades de la imagen
| Nombre | Tipo | Descripción |
|---|---|---|
| ALGORITHM_VERSION | STRING | Versión del algoritmo |
| GRID_INTERVAL | STRING | Resolución espacial |
| GRID_INTERVAL_UNIT | STRING | Unidad de GRID_INTERVAL |
| IMAGE_END_TIME | STRING | Hora de finalización de la adquisición de la imagen |
| IMAGE_START_TIME | STRING | Hora de inicio de la adquisición de la imagen |
| PROCESSING_RESULT | STRING | Good, Fair, Poor, NG |
| PROCESSING_UT | STRING | Tiempo de procesamiento |
| PRODUCT_FILENAME | STRING | Nombre del archivo fuente |
| PRODUCT_VERSION | STRING | Versión del producto |
| SATELLITE_DIRECTION | STRING | Dirección de la órbita satelital
|
| CHLA_AVE_OFFSET | STRING | Desplazamiento |
| CHLA_AVE_SLOPE | STRING | Pendiente |
Condiciones de Uso
Condiciones de Uso
Este conjunto de datos se puede usar de forma gratuita sin restricciones (incluido el uso comercial). Cualquier persona que desee publicar resultados analizados o productos de datos de valor agregado debe atribuir correctamente los datos originales de G-Portal, p.ej., "Datos de PR de la Agencia Japonesa de Exploración Aeroespacial". En el caso de los productos de datos de valor agregado, indica el crédito de los datos originales de G-Portal, p.ej., "Los datos originales de este producto de datos con valor agregado fueron proporcionados por la Agencia Japonesa de Exploración Aeroespacial".
Consulta las Condiciones del Servicio de G-Portal (Artículo 7) para obtener más información.
Citas
Murakami, H. (enero de 2020). ATBD del algoritmo de concentración de clorofila a de GCOM-C (versión 2). Disponible en https://suzaku.eorc.jaxa.jp/GCOM_C/data/ATBD/ver2/V2ATBD_O3AB_Chla_Murakami.pdf
Explora con Earth Engine
Editor de código (JavaScript)
var dataset = ee.ImageCollection('JAXA/GCOM-C/L3/OCEAN/CHLA/V2')
                .filterDate('2020-01-01', '2020-02-01')
                // filter to daytime data only
                .filter(ee.Filter.eq('SATELLITE_DIRECTION', 'D'));

// Multiply with slope coefficient
var image = dataset.mean().multiply(0.0016).log10();

var vis = {
  bands: ['CHLA_AVE'],
  min: -2,
  max: 2,
  palette: [
    '3500a8','0800ba','003fd6',
    '00aca9','77f800','ff8800',
    'b30000','920000','880000'
  ]
};

Map.addLayer(image, vis, 'Chlorophyll-a concentration');

Map.setCenter(128.45, 33.33, 5);