- 数据集可用时间
- 2002-07-01T00:00:00Z–2026-04-01T00:00:00Z
- 数据集生产者
- 美国地质调查局地球资源观测与科学中心下属的美国国家航空航天局陆地过程分布式主动存档中心
- 频率
- 1 个月
- 标签
说明
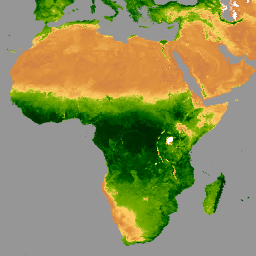
Aqua 中分辨率成像光谱仪 (MODIS) 植被指数 (MYD13A3) 版本 6.1 数据以网格化 3 级产品的形式提供,采用正弦曲线投影,空间分辨率为 1 公里 (km),每月更新一次。在生成此月度产品时,该算法会纳入与相应月份重叠的所有 MYD13A2 产品,并采用加权时间平均值。
文档:
频段
波段
像素大小:1,000 米(所有波段)
| 名称 | 单位 | 最小值 | 最大值 | 缩放系数 | 像元大小 | 波长 | 说明 | ||||||||||||||||||||||||||||||||||||||||||||||||||||||||||||||||||||||||||||||||||||||||||||
|---|---|---|---|---|---|---|---|---|---|---|---|---|---|---|---|---|---|---|---|---|---|---|---|---|---|---|---|---|---|---|---|---|---|---|---|---|---|---|---|---|---|---|---|---|---|---|---|---|---|---|---|---|---|---|---|---|---|---|---|---|---|---|---|---|---|---|---|---|---|---|---|---|---|---|---|---|---|---|---|---|---|---|---|---|---|---|---|---|---|---|---|---|---|---|---|---|---|---|---|
NDVI |
-2000 | 10000 | 0.0001 | 1000 米 | 无 | 月度 NDVI 平均值 |
|||||||||||||||||||||||||||||||||||||||||||||||||||||||||||||||||||||||||||||||||||||||||||||
EVI |
-2000 | 10000 | 0.0001 | 1000 米 | 无 | 月度 EVI 平均值 |
|||||||||||||||||||||||||||||||||||||||||||||||||||||||||||||||||||||||||||||||||||||||||||||
DetailedQA |
1000 米 | 无 | VI 质量指标 |
||||||||||||||||||||||||||||||||||||||||||||||||||||||||||||||||||||||||||||||||||||||||||||||||
sur_refl_b01 |
0 | 10000 | 0.0001 | 1000 米 | 620-670nm | 地表反射率波段 1(红色) |
|||||||||||||||||||||||||||||||||||||||||||||||||||||||||||||||||||||||||||||||||||||||||||||
sur_refl_b02 |
0 | 10000 | 0.0001 | 1000 米 | 841-876nm | 地表反射率波段 2(近红外) |
|||||||||||||||||||||||||||||||||||||||||||||||||||||||||||||||||||||||||||||||||||||||||||||
sur_refl_b03 |
0 | 10000 | 0.0001 | 1000 米 | 459-479nm | 地表反射率波段 3(蓝色) |
|||||||||||||||||||||||||||||||||||||||||||||||||||||||||||||||||||||||||||||||||||||||||||||
sur_refl_b07 |
0 | 10000 | 0.0001 | 1000 米 | 2105-2155nm | 地表反射率波段 7(中红外) |
|||||||||||||||||||||||||||||||||||||||||||||||||||||||||||||||||||||||||||||||||||||||||||||
ViewZenith |
度 | 0 | 18000 | 0.01 | 1000 米 | 无 | 查看 VI Pixel 的天顶角 |
||||||||||||||||||||||||||||||||||||||||||||||||||||||||||||||||||||||||||||||||||||||||||||
SolarZenith |
度 | 0 | 18000 | 0.01 | 1000 米 | 无 | VI 像素的太阳天顶角 |
||||||||||||||||||||||||||||||||||||||||||||||||||||||||||||||||||||||||||||||||||||||||||||
RelativeAzimuth |
度 | -18000 | 18000 | 0.01 | 1000 米 | 无 | VI 像素的相对方位角 |
||||||||||||||||||||||||||||||||||||||||||||||||||||||||||||||||||||||||||||||||||||||||||||
SummaryQA |
1000 米 | 无 | VI 像素的质量可靠性 |
||||||||||||||||||||||||||||||||||||||||||||||||||||||||||||||||||||||||||||||||||||||||||||||||
SummaryQA 类表
| 值 | 颜色 | 说明 |
|---|---|---|
| 0 | 无 | 优质数据:放心使用 |
| 1 | 无 | 边际数据:有用,但请查看其他 QA 信息 |
| 2 | 无 | 降雪/结冰:目标被雪/冰覆盖 |
| 3 | 无 | 多云:目标不可见,被云遮挡 |
使用条款
使用条款
通过 LP DAAC 获取的 MODIS 数据和产品在后续使用、销售或再分发方面没有任何限制。
引用
引用:
如需了解如何引用 LP DAAC 数据集,请访问 LP DAAC 的“引用我们的数据”页面。
DOI
通过 Earth Engine 探索
代码编辑器 (JavaScript)
var dataset = ee.ImageCollection('MODIS/061/MYD13A3')
                  .filter(ee.Filter.date('2020-01-01', '2023-05-01'));
var ndvi = dataset.select('NDVI');
var ndviVis = {
  min: 0,
  max: 9000,
  palette: [
    'ffffff', 'ce7e45', 'df923d', 'f1b555', 'fcd163', '99b718', '74a901',
    '66a000', '529400', '3e8601', '207401', '056201', '004c00', '023b01',
    '012e01', '011d01', '011301'
  ],
};
Map.setCenter(6.746, 46.529, 2);
Map.addLayer(ndvi, ndviVis, 'NDVI');