PRISM 일일 및 월별 데이터 세트는 오리건 주립대학교의 PRISM Climate Group에서 생성한 미국 본토의 그리드형 기후 데이터 세트입니다.
그리드는 PRISM (Parameter-elevation Regressions on Independent Slopes Model)을 사용하여 개발됩니다. PRISM 보간 루틴은 고도에 따라 날씨와 기후가 어떻게 달라지는지 시뮬레이션하고, 해안 효과, 온도 역전, 강수량을 감소시킬 수 있는 지형 장벽을 고려합니다. 관측소 데이터는 전국 여러 네트워크에서 동화됩니다. 자세한 내용은 PRISM 공간 기후 데이터 세트 설명을 참고하세요.
참고
경고: 이 데이터 세트는 관측소 장비 및 위치 변경, 개장 및 폐장, 관측 시간의 변화, 비교적 단기 네트워크의 사용으로 인한 비기후 변동으로 인해 100년 동안의 기후 추세를 계산하는 데 사용해서는 안 됩니다. 자세한 내용은 데이터 세트 문서
를 참고하세요.
애셋의 시작 시간이 UTC 자정이 아닌 UTC 정오입니다.
관측 네트워크에서 품질 관리를 수행하고 관측소 데이터를 출시하는 데 시간이 걸립니다. 따라서 PRISM 데이터 세트는 6개월이 지나 영구적인 것으로 간주될 때까지 여러 번 다시 모델링됩니다. 출시 일정을 확인하세요.
이 데이터 세트의 30초 (~800m) 버전을 사용하려면 prism-questions@nacse.org로 제공업체에 문의하세요.
대역
픽셀 크기 4638.3m
대역
이름
단위
최소
최대
픽셀 크기
설명
ppt
mm
0*
731.65*
미터
일일 총 강수량 (비와 녹은 눈 포함)
tmean
°C
-40.37*
45.98*
미터
일일 평균 온도(tmin+tmax)/2로 계산)
tmin
°C
-47.56*
39.59*
미터
일일 최저 온도
tmax
°C
-38.38*
54.13*
미터
일일 최고 온도
tdmean
°C
-46.18*
31.61*
미터
일일 평균 이슬점 온도
vpdmin
hPa
0*
69.86*
미터
일일 최소 증기압 부족
vpdmax
hPa
0*
142.42*
미터
일일 최대 증기압 부족
* 예상 최솟값 또는 최댓값
이미지 속성
이미지 속성
이름
유형
설명
PRISM_CODE_VERSION
STRING_LIST
대역별 코드 버전 목록입니다. 예를 들어 첫 번째 요소는 첫 번째 대역 'ppt'에 해당하고 두 번째 요소는 두 번째 대역 'tmean'에 해당합니다.
PRISM_DATASET_CREATE_DATE
STRING_LIST
밴드별 원본 생성 날짜 목록
PRISM_DATASET_FILENAME
STRING_LIST
각 밴드의 원본 파일 이름 목록
PRISM_DATASET_TYPE
STRING_LIST
밴드별 데이터 세트 유형 목록
PRISM_DATASET_VERSION
STRING_LIST
밴드별 데이터 세트 버전 목록입니다(예: 일일 제품의 경우 D1 또는 D2, 월간 제품의 경우 M1, M2 또는 M3).
상태
문자열
관찰 후 30일 이내에 생성된 데이터는 '조기' 상태입니다. 관찰 후 1~6개월 이내에 생성된 데이터는 '임시' 상태일 수 있으며 6개월이 지난 데이터는 '영구'로 표시됩니다.
이용약관
이용약관
이러한 PRISM 데이터 세트는 사용 또는 배포에 제한 없이 사용할 수 있습니다. PRISM Climate Group은 사용자가 적절한 출처 표시를 제공하고 해당되는 경우 PRISM을 데이터 소스로 식별하도록 요청합니다.
PRISM 일일 및 월별 데이터 세트는 오리건 주립대학교의 PRISM Climate Group에서 생성한 미국 본토의 격자형 기후 데이터 세트입니다. 그리드는 PRISM (Parameter-elevation Regressions on Independent Slopes Model)을 사용하여 개발됩니다. PRISM 보간 루틴은 고도에 따라 날씨와 기후가 어떻게 달라지는지 시뮬레이션하고 …
[null,null,[],[[["\u003cp\u003eThe PRISM daily dataset provides gridded climate data for the conterminous United States from 1981 to 2024, including precipitation, temperature, and vapor pressure deficit.\u003c/p\u003e\n"],["\u003cp\u003eDeveloped by Oregon State University's PRISM Climate Group, it uses the PRISM model to interpolate weather and climate variations based on elevation and terrain.\u003c/p\u003e\n"],["\u003cp\u003eThe dataset is freely available for use and distribution with proper attribution to PRISM.\u003c/p\u003e\n"],["\u003cp\u003eWhile valuable for various climate analyses, it's not recommended for calculating century-long trends due to potential biases in historical station data.\u003c/p\u003e\n"],["\u003cp\u003eData is updated regularly, with a release schedule available, and includes status flags indicating data maturity (early, provisional, permanent).\u003c/p\u003e\n"]]],[],null,["Dataset Availability\n: 1981-01-01T00:00:00Z--2025-08-29T12:00:00Z\n\nDataset Provider\n:\n\n\n [PRISM / OREGONSTATE](https://www.prism.oregonstate.edu/)\n\nCadence\n: 1 Day\n\nTags\n:\n[climate](/earth-engine/datasets/tags/climate) [daily](/earth-engine/datasets/tags/daily) [geophysical](/earth-engine/datasets/tags/geophysical) [oregonstate](/earth-engine/datasets/tags/oregonstate) [precipitation](/earth-engine/datasets/tags/precipitation) [pressure](/earth-engine/datasets/tags/pressure) [prism](/earth-engine/datasets/tags/prism) [temperature](/earth-engine/datasets/tags/temperature) [vapor](/earth-engine/datasets/tags/vapor) [weather](/earth-engine/datasets/tags/weather) \n\nDescription \nThe PRISM daily and monthly datasets are gridded climate\ndatasets for the conterminous United States, produced by the\nPRISM Climate Group at Oregon State University.\n\nGrids are\ndeveloped using PRISM (Parameter-elevation Regressions on Independent\nSlopes Model). PRISM interpolation routines simulate how weather\nand climate vary with elevation, and account for coastal effects,\ntemperature inversions, and terrain barriers that can cause rain\nshadows. Station data are assimilated from many networks across\nthe country. For more information, see the [Descriptions of PRISM\nSpatial Climate Datasets](https://www.prism.oregonstate.edu/documents/PRISM_datasets.pdf).\n\n**Note**\n\n- **Warning** : This dataset should not be used to calculate century-long climate trends due to non-climatic variations from to station equipment and location changes, openings and closings, varying observation times, and the use of relatively short-term networks. Please see the [dataset documentation](https://www.prism.oregonstate.edu/documents/PRISM_datasets.pdf) for more details.\n- The assets have start time of noon UTC, not midnight UTC.\n- It takes time for observation networks to conduct quality control and release station data. Therefore, PRISM datasets are re-modeled several times until six months have elapsed, when they are considered permanent. A [release\n schedule is available](https://www.prism.oregonstate.edu/calendar/).\n- For use of the 30 arc-second (\\~800 m) version of this dataset please contact the provider at prism-questions@nacse.org\n\nBands\n\n\n**Pixel Size**\n\n4638.3 meters\n\n**Bands**\n\n| Name | Units | Min | Max | Pixel Size | Description |\n|----------|-------|----------|----------|------------|------------------------------------------------------------|\n| `ppt` | mm | 0\\* | 731.65\\* | meters | Daily total precipitation (including rain and melted snow) |\n| `tmean` | °C | -40.37\\* | 45.98\\* | meters | Daily mean temperature (calculated as (tmin+tmax)/2) |\n| `tmin` | °C | -47.56\\* | 39.59\\* | meters | Daily minimum temperature |\n| `tmax` | °C | -38.38\\* | 54.13\\* | meters | Daily maximum temperature |\n| `tdmean` | °C | -46.18\\* | 31.61\\* | meters | Daily mean dew point temperature |\n| `vpdmin` | hPa | 0\\* | 69.86\\* | meters | Daily minimum vapor pressure deficit |\n| `vpdmax` | hPa | 0\\* | 142.42\\* | meters | Daily maximum vapor pressure deficit |\n\n\\* estimated min or max value\n\nImage Properties\n\n**Image Properties**\n\n| Name | Type | Description |\n|---------------------------|-------------|-----------------------------------------------------------------------------------------------------------------------------------------------------------------------------------------------------------------|\n| PRISM_CODE_VERSION | STRING_LIST | List of code versions per-band, e.g: the first element is for the first band \"ppt\", the second element is for the second band \"tmean\" |\n| PRISM_DATASET_CREATE_DATE | STRING_LIST | List of original creation dates per-band |\n| PRISM_DATASET_FILENAME | STRING_LIST | List of original filenames for each band |\n| PRISM_DATASET_TYPE | STRING_LIST | List of dataset types per-band |\n| PRISM_DATASET_VERSION | STRING_LIST | List of dataset versions per-band e.g: D1 or D2 for daily products; M1, M2 or M3 for monthly products. |\n| status | STRING | Data generated within 30 days of observation have the status \"early\". Data generated within 1-6 months of observation may have the status \"provisional\" and data older than 6 months are marked as \"permanent\". |\n\nTerms of Use\n\n**Terms of Use**\n\nThese PRISM datasets are available without restriction\non use or distribution. PRISM Climate Group does request that the\nuser give proper attribution and identify PRISM, where applicable,\nas the source of the data.\n\nCitations \nCitations:\n\n- [Daly, C., Halbleib, M., Smith, J.I., Gibson, W.P., Doggett, M.K.,\n Taylor, G.H., Curtis, J., and Pasteris, P.A. 2008. Physiographically-sensitive\n mapping of temperature and precipitation across the conterminous\n United States. International Journal of Climatology, 28: 2031-2064](https://www.prism.oregonstate.edu/documents/pubs/2008intjclim_physiographicMapping_daly.pdf)\n- \\[Daly, C., J.I. Smith, and K.V. Olson. 2015. Mapping atmospheric\n moisture climatologies across the conterminous United States. PloS\n ONE 10(10):e0141140.\n [doi:10.1371/journal.pone.0141140](https://doi.org/10.1371/journal.pone.0141140).\n\nDOIs\n\n- \u003chttps://doi.org/10.1371/journal.pone.0141140\u003e\n\nExplore with Earth Engine **Important:** Earth Engine is a platform for petabyte-scale scientific analysis and visualization of geospatial datasets, both for public benefit and for business and government users. Earth Engine is free to use for research, education, and nonprofit use. To get started, please [register for Earth Engine access.](https://console.cloud.google.com/earth-engine)\n\nCode Editor (JavaScript) \n\n```javascript\n
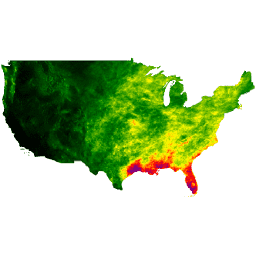
var dataset = ee.ImageCollection('OREGONSTATE/PRISM/AN81d')\n .filter(ee.Filter.date('2018-08-01', '2018-08-15'));\nvar precipitation = dataset.select('ppt');\nvar precipitationVis = {\n min: 0.0,\n max: 50.0,\n palette: ['red', 'yellow', 'green', 'cyan', 'purple'],\n};\nMap.setCenter(-100.55, 40.71, 4);\nMap.addLayer(precipitation, precipitationVis, 'Precipitation');\n```\n[Open in Code Editor](https://code.earthengine.google.com/?scriptPath=Examples:Datasets/OREGONSTATE/OREGONSTATE_PRISM_AN81d) \n[PRISM Daily Spatial Climate Dataset AN81d](/earth-engine/datasets/catalog/OREGONSTATE_PRISM_AN81d) \nThe PRISM daily and monthly datasets are gridded climate datasets for the conterminous United States, produced by the PRISM Climate Group at Oregon State University. Grids are developed using PRISM (Parameter-elevation Regressions on Independent Slopes Model). PRISM interpolation routines simulate how weather and climate vary with elevation, and account for ... \nOREGONSTATE/PRISM/AN81d, climate,daily,geophysical,oregonstate,precipitation,pressure,prism,temperature,vapor,weather \n1981-01-01T00:00:00Z/2025-08-29T12:00:00Z \n24 -125 50 -66 \nGoogle Earth Engine \nhttps://developers.google.com/earth-engine/datasets\n\n- [https://doi.org/10.1371/journal.pone.0141140](https://doi.org/https://www.prism.oregonstate.edu/)\n- [https://doi.org/10.1371/journal.pone.0141140](https://doi.org/https://developers.google.com/earth-engine/datasets/catalog/OREGONSTATE_PRISM_AN81d)"]]