مجموعه دادههای روزانه و ماهانه PRISM مجموعه دادههای آب و هوایی شبکهبندیشده برای ایالات متحده است که توسط گروه آب و هوای PRISM در دانشگاه ایالتی اورگان تولید شدهاند.
شبکهها با استفاده از PRISM (رگرسیون ارتفاعی پارامتر در مدل شیبهای مستقل) توسعه مییابند. روالهای درونیابی PRISM نحوه تغییر آب و هوا و آب و هوا را با ارتفاع شبیهسازی میکنند و اثرات ساحلی، وارونگی دما و موانع زمین را که میتوانند باعث سایههای باران شوند، در نظر میگیرند. داده های ایستگاه از بسیاری از شبکه ها در سراسر کشور جذب می شود. برای اطلاعات بیشتر، به توضیحات مجموعه داده های آب و هوایی فضایی PRISM مراجعه کنید.
توجه داشته باشید
هشدار ، این مجموعه داده نباید برای محاسبه روندهای اقلیمی در طول یک قرن به دلیل تغییرات غیراقلیمی از تجهیزات ایستگاه و تغییرات مکان، بازها و بسته شدنها، زمانهای مشاهده متفاوت و استفاده از شبکههای نسبتاً کوتاه مدت استفاده شود. لطفاً برای جزئیات بیشتر به مستندات مجموعه داده مراجعه کنید.
برای انجام کنترل کیفیت و انتشار داده های ایستگاه توسط شبکه های مشاهده، زمان می برد. بنابراین، مجموعه دادههای PRISM چندین بار مجدداً مدلسازی میشوند تا زمانی که شش ماه سپری شود، زمانی که دائمی در نظر گرفته میشوند. برنامه زمانبندی انتشار موجود است .
برای استفاده از نسخه 30 ثانیه قوس (~800 متر) این مجموعه داده، لطفاً با ارائه دهنده به آدرس prism-questions@nacse.org تماس بگیرید.
باندها
اندازه پیکسل 4638.3 متر
باندها
نام
واحدها
حداقل
حداکثر
اندازه پیکسل
توضیحات
ppt
میلی متر
0*
2639.82*
متر
کل بارندگی ماهانه (شامل باران و برف ذوب شده)
tmean
درجه سانتی گراد
-30.8*
41.49*
متر
میانگین ماهانه میانگین دمای روزانه (محاسبه شده به صورت (tmin+tmax)/2)
tmin
درجه سانتی گراد
-35.11*
34.72*
متر
حداقل دمای ماهانه
tmax
درجه سانتی گراد
-29.8*
49.74*
متر
میانگین ماهانه حداکثر دمای روزانه
tdmean
درجه سانتی گراد
-30.7*
26.76*
متر
میانگین ماهانه میانگین دمای نقطه شبنم روزانه
vpdmin
hPa
0*
44.79*
متر
میانگین ماهانه حداقل کسری فشار بخار روزانه
vpdmax
hPa
0.009*
110.06*
متر
میانگین ماهانه کسری حداکثر فشار بخار روزانه
* حداقل یا حداکثر مقدار تخمینی
ویژگی های تصویر
ویژگی های تصویر
نام
تایپ کنید
توضیحات
PRISM_CODE_VERSION
STRING_LIST
لیست نسخه های کد در هر باند، به عنوان مثال: عنصر اول برای باند اول "ppt"، عنصر دوم برای باند دوم "tmean" است.
PRISM_DATASET_CREATE_DATE
STRING_LIST
فهرست تاریخ های ایجاد اصلی در هر باند
PRISM_DATASET_FILENAME
STRING_LIST
لیست نام فایل های اصلی برای هر باند
PRISM_DATASET_TYPE
STRING_LIST
فهرست انواع مجموعه داده در هر باند
PRISM_DATASET_VERSION
STRING_LIST
فهرست نسخه های مجموعه داده در هر باند به عنوان مثال: D1 یا D2 برای محصولات روزانه. M1، M2 یا M3 برای محصولات ماهانه.
وضعیت
STRING
داده های تولید شده در 30 روز پس از مشاهده وضعیت "زود" دارند. داده های تولید شده طی 1 تا 6 ماه پس از مشاهده ممکن است وضعیت "موقت" داشته باشند و داده های قدیمی تر از 6 ماه به عنوان "دائمی" علامت گذاری شوند.
شرایط استفاده
شرایط استفاده
این مجموعه داده های PRISM بدون محدودیت در استفاده یا توزیع در دسترس هستند. گروه آب و هوای PRISM از کاربر درخواست می کند که نسبت مناسبی را ارائه دهد و در صورت لزوم، PRISM را به عنوان منبع داده شناسایی کند.
[Daly، C.، JI Smith، و KV Olson. 2015. نقشه برداری اقلیم شناسی رطوبت اتمسفر در سراسر ایالات متحده. PloS ONE 10(10):e0141140. doi:10.1371/journal.pone.0141140 .
مجموعه دادههای روزانه و ماهانه PRISM مجموعه دادههای آب و هوایی شبکهبندیشده برای ایالات متحده است که توسط گروه آب و هوای PRISM در دانشگاه ایالتی اورگان تولید شدهاند. شبکهها با استفاده از PRISM (رگرسیون ارتفاعی پارامتر در مدل شیبهای مستقل) توسعه مییابند. روال های درون یابی PRISM نحوه تغییر آب و هوا و آب و هوا با ارتفاع را شبیه سازی می کنند و به حساب…
OREGONSTATE/PRISM/AN81m، آب و هوا، ژئوفیزیک، ماهانه، منطقه ای، بارش، فشار، منشور، دما، بخار، آب و هوا
[null,null,[],[[["\u003cp\u003eThe PRISM AN81m dataset provides monthly gridded climate data for the conterminous United States from 1895 to 2024.\u003c/p\u003e\n"],["\u003cp\u003eIt includes precipitation, temperature, dew point temperature, and vapor pressure deficit data, calculated using the PRISM interpolation model.\u003c/p\u003e\n"],["\u003cp\u003eData is assimilated from various station networks, accounting for terrain and coastal effects on weather patterns.\u003c/p\u003e\n"],["\u003cp\u003eWhile freely available for use and distribution, the dataset is not suitable for century-long climate trend analysis due to inherent limitations.\u003c/p\u003e\n"],["\u003cp\u003eUsers are encouraged to attribute PRISM as the data source when utilizing this dataset.\u003c/p\u003e\n"]]],[],null,["# PRISM Monthly Spatial Climate Dataset AN81m\n\nDataset Availability\n: 1895-01-01T00:00:00Z--2025-07-01T00:00:00Z\n\nDataset Provider\n:\n\n\n [PRISM / OREGONSTATE](https://www.prism.oregonstate.edu/)\n\nCadence\n: 1 Month\n\nTags\n:\n[climate](/earth-engine/datasets/tags/climate) [geophysical](/earth-engine/datasets/tags/geophysical) [monthly](/earth-engine/datasets/tags/monthly) [oregonstate](/earth-engine/datasets/tags/oregonstate) [precipitation](/earth-engine/datasets/tags/precipitation) [pressure](/earth-engine/datasets/tags/pressure) [prism](/earth-engine/datasets/tags/prism) [temperature](/earth-engine/datasets/tags/temperature) [vapor](/earth-engine/datasets/tags/vapor) [weather](/earth-engine/datasets/tags/weather) \n\n#### Description\n\nThe PRISM daily and monthly datasets are gridded climate\ndatasets for the conterminous United States, produced by the\nPRISM Climate Group at Oregon State University.\n\nGrids are\ndeveloped using PRISM (Parameter-elevation Regressions on Independent\nSlopes Model). PRISM interpolation routines simulate how weather\nand climate vary with elevation, and account for coastal effects,\ntemperature inversions, and terrain barriers that can cause rain\nshadows. Station data are assimilated from many networks across\nthe country. For more information, see the [Descriptions of PRISM\nSpatial Climate Datasets](https://www.prism.oregonstate.edu/documents/PRISM_datasets.pdf).\n\n**Note**\n\n- **Warning** , this dataset should not be used to calculate century-long climate trends due to non-climatic variations from to station equipment and location changes, openings and closings, varying observation times, and the use of relatively short-term networks. Please see the [dataset\n documentation](https://www.prism.oregonstate.edu/documents/PRISM_datasets.pdf) for more details.\n- It takes time for observation networks to conduct quality control and release station data. Therefore, PRISM datasets are re-modeled several times until six months have elapsed, when they are considered permanent. A [release schedule is\n available](https://www.prism.oregonstate.edu/calendar/).\n- For use of the 30 arc-second (\\~800 m) version of this dataset please contact the provider at prism-questions@nacse.org.\n\n### Bands\n\n\n**Pixel Size**\n\n4638.3 meters\n\n**Bands**\n\n| Name | Units | Min | Max | Pixel Size | Description |\n|----------|-------|----------|-----------|------------|-------------------------------------------------------------------------|\n| `ppt` | mm | 0\\* | 2639.82\\* | meters | Monthly total precipitation (including rain and melted snow) |\n| `tmean` | °C | -30.8\\* | 41.49\\* | meters | Monthly average of daily mean temperature (calculated as (tmin+tmax)/2) |\n| `tmin` | °C | -35.11\\* | 34.72\\* | meters | Monthly minimum temperature |\n| `tmax` | °C | -29.8\\* | 49.74\\* | meters | Monthly average of daily maximum temperature |\n| `tdmean` | °C | -30.7\\* | 26.76\\* | meters | Monthly average of daily mean dew point temperature |\n| `vpdmin` | hPa | 0\\* | 44.79\\* | meters | Monthly average of daily minimum vapor pressure deficit |\n| `vpdmax` | hPa | 0.009\\* | 110.06\\* | meters | Monthly average of daily maximum vapor pressure deficit |\n\n\\* estimated min or max value\n\n### Image Properties\n\n**Image Properties**\n\n| Name | Type | Description |\n|---------------------------|-------------|-----------------------------------------------------------------------------------------------------------------------------------------------------------------------------------------------------------------|\n| PRISM_CODE_VERSION | STRING_LIST | List of code versions per-band, e.g: the first element is for the first band \"ppt\", the second element is for the second band \"tmean\" |\n| PRISM_DATASET_CREATE_DATE | STRING_LIST | List of original creation dates per-band |\n| PRISM_DATASET_FILENAME | STRING_LIST | List of original filenames for each band |\n| PRISM_DATASET_TYPE | STRING_LIST | List of dataset types per-band |\n| PRISM_DATASET_VERSION | STRING_LIST | List of dataset versions per-band e.g: D1 or D2 for daily products; M1, M2 or M3 for monthly products. |\n| status | STRING | Data generated within 30 days of observation have the status \"early\". Data generated within 1-6 months of observation may have the status \"provisional\" and data older than 6 months are marked as \"permanent\". |\n\n### Terms of Use\n\n**Terms of Use**\n\nThese PRISM datasets are available without restriction\non use or distribution. PRISM Climate Group does request that the\nuser give proper attribution and identify PRISM, where applicable,\nas the source of the data.\n\n### Citations\n\nCitations:\n\n- [Daly, C., Halbleib, M., Smith, J.I., Gibson, W.P., Doggett, M.K.,\n Taylor, G.H., Curtis, J., and Pasteris, P.A. 2008. Physiographically-sensitive\n mapping of temperature and precipitation across the conterminous\n United States. International Journal of Climatology, 28: 2031-2064](https://www.prism.oregonstate.edu/documents/pubs/2008intjclim_physiographicMapping_daly.pdf)\n- \\[Daly, C., J.I. Smith, and K.V. Olson. 2015. Mapping atmospheric\n moisture climatologies across the conterminous United States. PloS\n ONE 10(10):e0141140.\n [doi:10.1371/journal.pone.0141140](https://doi.org/10.1371/journal.pone.0141140).\n\n### DOIs\n\n- \u003chttps://doi.org/10.1371/journal.pone.0141140\u003e\n\n### Explore with Earth Engine\n\n| **Important:** Earth Engine is a platform for petabyte-scale scientific analysis and visualization of geospatial datasets, both for public benefit and for business and government users. Earth Engine is free to use for research, education, and nonprofit use. To get started, please [register for Earth Engine access.](https://console.cloud.google.com/earth-engine)\n\n### Code Editor (JavaScript)\n\n```javascript\n
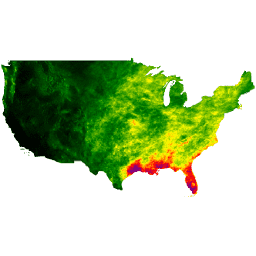
var dataset = ee.ImageCollection('OREGONSTATE/PRISM/AN81m')\n .filter(ee.Filter.date('2018-07-01', '2018-07-31'));\nvar precipitation = dataset.select('ppt');\nvar precipitationVis = {\n min: 0.0,\n max: 300.0,\n palette: ['red', 'yellow', 'green', 'cyan', 'purple'],\n};\nMap.setCenter(-100.55, 40.71, 4);\nMap.addLayer(precipitation, precipitationVis, 'Precipitation');\n```\n[Open in Code Editor](https://code.earthengine.google.com/?scriptPath=Examples:Datasets/OREGONSTATE/OREGONSTATE_PRISM_AN81m) \n[PRISM Monthly Spatial Climate Dataset AN81m](/earth-engine/datasets/catalog/OREGONSTATE_PRISM_AN81m) \nThe PRISM daily and monthly datasets are gridded climate datasets for the conterminous United States, produced by the PRISM Climate Group at Oregon State University. Grids are developed using PRISM (Parameter-elevation Regressions on Independent Slopes Model). PRISM interpolation routines simulate how weather and climate vary with elevation, and account for ... \nOREGONSTATE/PRISM/AN81m, climate,geophysical,monthly,oregonstate,precipitation,pressure,prism,temperature,vapor,weather \n1895-01-01T00:00:00Z/2025-07-01T00:00:00Z \n24 -125 50 -66 \nGoogle Earth Engine \nhttps://developers.google.com/earth-engine/datasets\n\n- [https://doi.org/10.1371/journal.pone.0141140](https://doi.org/https://www.prism.oregonstate.edu/)\n- [https://doi.org/10.1371/journal.pone.0141140](https://doi.org/https://developers.google.com/earth-engine/datasets/catalog/OREGONSTATE_PRISM_AN81m)"]]