- در دسترس بودن مجموعه دادهها
- 1991-01-01T00:00:00Z–2020-12-31T00:00:00Z
- تولیدکننده مجموعه داده
- پریزم / ایالت اورگان
- بازه اقلیمی
- ۱ ماه
- برچسبها
- 30 ساله
توضیحات
مجموعه دادههای روزانه و ماهانه PRISM، مجموعه دادههای آب و هوایی شبکهبندی شده برای ایالات متحده هستند که توسط گروه آب و هوایی PRISM در دانشگاه ایالتی اورگان تولید شدهاند.
شبکهها با استفاده از PRISM (رگرسیونهای پارامتر-ارتفاع روی مدل شیبهای مستقل) توسعه داده میشوند. روالهای درونیابی PRISM، چگونگی تغییر آب و هوا و اقلیم با ارتفاع را شبیهسازی میکنند و اثرات ساحلی، وارونگی دما و موانع زمینی که میتوانند باعث سایههای باران شوند را در نظر میگیرند. دادههای ایستگاهها از بسیاری از شبکههای سراسر کشور جمعآوری میشوند. برای اطلاعات بیشتر، به توضیحات مجموعه دادههای اقلیمی مکانی PRISM مراجعه کنید.
باندها
باندها
اندازه پیکسل: ۹۲۸ متر (همه باندها)
| نام | واحدها | حداقل | مکس | اندازه پیکسل | توضیحات |
|---|---|---|---|---|---|
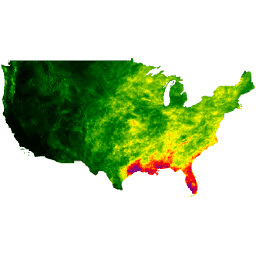
ppt | میلیمتر | 0.03* | ۱۰۴۶.۰۹* | ۹۲۸ متر | میانگین ۳۰ ساله کل بارندگی ماهانه (شامل باران و برف ذوب شده) |
tmean | درجه سانتیگراد | -۱۶.۱۵* | ۳۷.۸۸* | ۹۲۸ متر | میانگین دمای ماهانه ۳۰ ساله (به صورت (tmin+tmax)/۲ محاسبه میشود) |
tmin | درجه سانتیگراد | -۲۱.۹* | ۲۹.۷۹* | ۹۲۸ متر | میانگین ۳۰ ساله حداقل دمای ماهانه |
tmax | درجه سانتیگراد | -۱۰.۷۸* | ۴۶.۶۳* | ۹۲۸ متر | میانگین ۳۰ ساله حداکثر دمای ماهانه |
tdmean | درجه سانتیگراد | -۱۹.۰۷* | ۲۵.۲۲* | ۹۲۸ متر | میانگین ۳۰ ساله میانگین دمای نقطه شبنم ماهانه |
vpdmin | هکتوپاسکال | 0* | ۳۳.۱۱* | ۹۲۸ متر | میانگین 30 ساله حداقل کسری فشار بخار ماهانه |
vpdmax | هکتوپاسکال | ۰.۳۷* | ۹۴.۱۱* | ۹۲۸ متر | میانگین ۳۰ ساله حداکثر کسری فشار بخار ماهانه |
solclear | مگاژول m^-2 روز^-1 | ۹۲۸ متر | میانگین ۳۰ ساله تابش خورشیدی موج کوتاه ماهانه جهانی دریافت شده بر روی سطح افقی در شرایط آسمان صاف | ||
solslope | مگاژول m^-2 روز^-1 | ۹۲۸ متر | میانگین ۳۰ ساله تابش خورشیدی موج کوتاه ماهانه جهانی دریافت شده بر روی یک سطح شیبدار | ||
soltotal | مگاژول m^-2 روز^-1 | ۹۲۸ متر | میانگین ۳۰ ساله تابش خورشیدی موج کوتاه ماهانه جهانی که بر روی یک سطح افقی دریافت میشود | ||
soltrans | کسر | ۹۲۸ متر | میانگین ۳۰ ساله عبور از جو (ابری بودن) |
ویژگیهای تصویر
ویژگیهای تصویر
| نام | نوع | توضیحات |
|---|---|---|
| PRISM_DATASET_CREATE_DATE | لیست رشتهای | فهرست تاریخهای ایجاد اولیه برای هر گروه، به عنوان مثال: عنصر اول برای گروه اول "ppt" است، عنصر دوم برای گروه دوم "tmean" است. |
| نوع مجموعه داده PRISM | لیست رشتهای | فهرست انواع مجموعه دادهها در هر باند |
| نسخه کد پریزم | لیست رشتهای | فهرست نسخههای کد به ازای هر باند |
| نام فایل مجموعه داده PRISM | لیست رشتهای | فهرست نام فایلهای اصلی به ازای هر باند |
شرایط استفاده
شرایط استفاده
این مجموعه دادههای PRISM بدون محدودیت در استفاده یا توزیع در دسترس هستند. گروه اقلیمی PRISM از کاربر درخواست میکند که منبع دادهها را به درستی ذکر کرده و در صورت لزوم، PRISM را به عنوان منبع دادهها معرفی کند. https://prism.oregonstate.edu/terms/
نقل قولها
دالی، سی.، هالبلیب، ام.، اسمیت، جی.آی.، گیبسون، دبلیو.پی.، داگت، ام.کی.، تیلور، جی.اچ.، کرتیس، جی.، و پاستریس، پنسیلوانیا ۲۰۰۸. نقشهبرداری دما و بارش در سراسر ایالات متحده با توجه به شرایط فیزیوگرافی. مجله بینالمللی اقلیمشناسی، ۲۸: ۲۰۳۱-۲۰۶۴ doi:10.1002/joc.1688 pdf .
[Daly, C., JI Smith, and KV Olson. 2015. نقشهبرداری از اقلیمشناسی رطوبت جوی در سراسر ایالات متحده. PloS ONE 10(10):e0141140. doi:10.1371/journal.pone.0141140 .]
DOI ها
با موتور زمین کاوش کنید
ویرایشگر کد (جاوااسکریپت)
var dataset = ee.ImageCollection('OREGONSTATE/PRISM/Norm91m');
var precipitation = dataset.select('ppt');
var precipitationVis = {
  min: 0.0,
  max: 300.0,
  palette: ['red', 'yellow', 'green', 'cyan', 'purple'],
};
Map.setCenter(-100.55, 40.71, 0);
Map.addLayer(precipitation, precipitationVis, 'Precipitation');