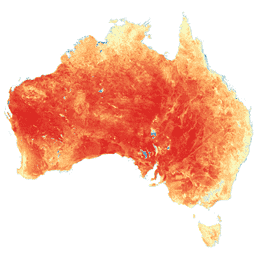
Este conjunto de datos proporciona la evapotranspiración real (AET o ETa) precisa para Australia con el algoritmo CMRSET. La banda de AET (denominada "ETa") contiene el valor diario promedio del modelo CMRSET para todas las observaciones de Landsat sin nubes de ese mes (indicado con el valor 3 en los bits de QA de la fuente de datos de AET). Después de que el corrector de líneas de exploración (SLC) del ETM+ de Landsat 7 falló el 31 de mayo de 2003, los datos del ETM+ de Landsat 7 solo se usan si no hay datos del TM de Landsat 5 o del OLI de Landsat 8 sin nubes para ese mes. Si no hay datos de Landsat sin nubes disponibles, los píxeles se rellenan con datos combinados. Los datos combinados serán una combinación de Landsat y MODIS hasta febrero de 2012, y luego una combinación de Landsat y VIIRS (indicado con el valor 2 en los bits de QA de la fuente de datos de AET). Si no hay datos combinados disponibles en un mes, los valores mensuales faltantes del AET se interpolan de forma lineal (se indican con el valor 1 en los bits de QA de la fuente de datos del AET). Esto significa que los datos de AET mensuales de 30 m que abarcan toda Australia, sin brechas debido a las nubes, están disponibles y listos para usarse.
La información precisa sobre la AET es importante para el riego, la seguridad alimentaria y la administración ambiental. Al igual que en muchas otras partes del mundo, la disponibilidad de agua en Australia es limitada, y la AET es el componente de consumo más grande del balance hídrico. En Australia, el 70% del agua disponible se utiliza para el riego de cultivos y pastos. Una mejor supervisión respaldará una mayor eficiencia en el uso del agua en este sector, y cualquier ahorro de agua estará disponible como caudales ambientales. Además, los ecosistemas dependientes de aguas subterráneas (GDE) ocupan un área pequeña, pero son "puntos críticos de biodiversidad". Conocer sus necesidades de agua permite mejorar la gestión de estas áreas críticas. La AET también se puede usar para modelar el balance hídrico de la cuenca. Si se usa en cálculos de equilibrio hídrico (equilibrio de masa), este valor de AET se debe multiplicar por la cantidad de días del mes.
Para que los desarrolladores sepan que usas este conjunto de datos, obtener información sobre las actualizaciones o si tienes alguna pregunta, comunícate con tim.mcvicar@csiro.au, tom.vanniel@csiro.au o jamie.vleeshouwer@csiro.au.
Bandas
Tamaño de píxel 30 metros
Bandas
Nombre
Unidades
Tamaño de los píxeles
Descripción
ETa
mm/d
metros
Evapotranspiración diaria promedio
pixel_qa
metros
Atributos de QA de píxeles
Máscara de bits para pixel_qa
Bits 0-1: Fuente de datos de AET
0: No aplicable (es decir, océanos circundantes)
1: El valor del AET se interpoló de forma lineal.
2: El valor del AET se obtuvo a partir de la combinación de datos.
(CMRSET_MCD43_C6_LANDSAT_V2_0 hasta febrero de 2012 y, luego, CMRSET_VIIRS_LANDSAT_V2_0)
3: El valor de AET provino de CMRSET_LANDSAT_V2_0
Bit 2: Ajuste de condensación
0: El valor del AET no se ajustó.
1: El valor de AET se ajustó a 0 mm/día (debido a un valor negativo).
Bits del 3 al 6: Cantidad de observaciones de Landsat utilizadas para este píxel (de 0 a 15).
Bit 7: SLC-Off
0: No se aplicó SLC-Off.
1: Se aplicó SLC-Off a Landsat 7 (puede contener artefactos del sensor).
Juan P. Guerschman, Tim R. McVicar, Jamie Vleeshower, Thomas G. Van Niel,
Jorge L. Peña-Arancibia, Yun Chen. Estimating actual evapotranspiration at
field-to-continent scales by calibrating the CMRSET algorithm with MODIS,
VIIRS, Landsat and Sentinel-2 data, Journal of Hydrology, Volume 605, 2022,
127318,
doi:10.1016/j.jhydrol.2021.127318.
Este conjunto de datos proporciona la evapotranspiración real (ETR o ETa) precisa para Australia con el algoritmo CMRSET. La banda de AET (denominada "ETa") contiene el valor diario promedio del modelo CMRSET para todas las observaciones de Landsat sin nubes de ese mes (indicado con el valor 3 en los bits de QA de la fuente de datos de AET). Después de…
[null,null,[],[[["\u003cp\u003eThe TERN/AET/CMRSET_LANDSAT_V2_2 dataset provides daily actual evapotranspiration (AET) estimates for Australia from 2000-02-01 to 2024-06-01.\u003c/p\u003e\n"],["\u003cp\u003eIt utilizes the CMRSET algorithm with Landsat data, incorporating blending and interpolation for cloud-free, gap-free coverage.\u003c/p\u003e\n"],["\u003cp\u003eAET data is crucial for managing water resources, especially in agriculture, and supports applications like irrigation and environmental monitoring.\u003c/p\u003e\n"],["\u003cp\u003eThe dataset is available at 30-meter resolution and includes a pixel QA band for data source and quality information.\u003c/p\u003e\n"],["\u003cp\u003eUsers are encouraged to contact the developers for updates or questions.\u003c/p\u003e\n"]]],[],null,["# Actual Evapotranspiration for Australia (CMRSET Landsat V2.2)\n\nDataset Availability\n: 2000-02-01T00:00:00Z--2024-06-01T00:00:00Z\n\nDataset Provider\n:\n\n\n [TERN Landscapes / CSIRO Land and Water](https://portal.tern.org.au/actual-evapotranspiration-australia-cmrset-algorithm/21915)\n\nTags\n:\n [agriculture](/earth-engine/datasets/tags/agriculture) [australia](/earth-engine/datasets/tags/australia) [csiro](/earth-engine/datasets/tags/csiro) [evaporation](/earth-engine/datasets/tags/evaporation) [evapotranspiration](/earth-engine/datasets/tags/evapotranspiration) [landsat-derived](/earth-engine/datasets/tags/landsat-derived) [tern](/earth-engine/datasets/tags/tern) [water-vapor](/earth-engine/datasets/tags/water-vapor) \nviirs-derived \n\n#### Description\n\nThis dataset provides accurate actual evapotranspiration (AET or ETa) for\nAustralia using the CMRSET algorithm. The AET band (named 'ETa') contains\nthe average daily value from the CMRSET model for all cloud-free Landsat\nobservations in that month (indicated with value 3 in the AET Data Source QA\nbits). After the Landsat 7 ETM+ Scan Line Corrector (SLC) failed on 31 May\n2003, Landsat 7 ETM+ data are only used if there are no cloud-free Landsat 5\nTM or Landsat 8 OLI data for that month. If there is no cloud-free Landsat\ndata available, pixels are infilled with blended data. The blended data will\nbe blended Landsat-MODIS until Feb 2012, then blended Landsat-VIIRS onwards\n(indicated with value 2 in the AET Data Source QA bits). If there is no\nblended data available in a month, then missing monthly AET values are\nlinearly interpolated (indicated with value 1 in the AET Data Source QA\nbits). This means monthly 30 m AET data covering all Australia, with no gaps\ndue to cloud, are available and ready to use.\n\nAccurate AET information is important for irrigation, food security, and\nenvironmental management. Like many other parts of the world, water\navailability in Australia is limited and AET is the largest consumptive\ncomponent of the water balance. In Australia 70% of available water is used\nfor crop and pasture irrigation. Better monitoring will support improved\nwater use efficiency in this sector, with any water savings available as\nenvironmental flows. Additionally, ground-water dependent ecosystems (GDE)\noccupy a small area yet are \"biodiversity hotspots\". Knowing their water\nneeds enables enhanced management of these critical areas. AET can also be\nused to model the catchment water balance. If used in water balance (mass\nbalance) calculations, then this AET value needs to be multiplied by the\nnumber of days in the month.\n\nTo let the developers know you are using this dataset, to get information on\nupdates, or if you have any questions please contact: tim.mcvicar@csiro.au,\ntom.vanniel@csiro.au, jamie.vleeshouwer@csiro.au.\n\n### Bands\n\n\n**Pixel Size**\n\n30 meters\n\n**Bands**\n\n| Name | Units | Pixel Size | Description |\n|------------|-------|------------|----------------------------------|---|---|---|---|---|---|---|---|---|---|---|---|---|---|---|---|---|---|---|---|---|---|---|---|---|---|---|---|---|---|---|---|---|---|---|---|---|---|---|---|---|---|---|---|---|---|---|---|---|---|---|---|---|---|---|---|---|---|---|---|---|---|---|---|---|---|---|---|---|---|---|---|---|---|---|---|---|---|---|---|---|---|---|---|---|---|---|---|---|---|---|---|---|---|---|---|\n| `ETa` | mm/d | meters | Average daily evapotranspiration |\n| `pixel_qa` | | meters | Pixel QA attributes |\n| Bitmask for pixel_qa - Bits 0-1: AET Data Source - 0: N/A (i.e., surrounding oceans) - 1: AET value was linearly interpolated. - 2: AET value was from data blending. (CMRSET_MCD43_C6_LANDSAT_V2_0 until Feb 2012, then CMRSET_VIIRS_LANDSAT_V2_0 onwards) - 3: AET value was from CMRSET_LANDSAT_V2_0 - Bit 2: Condensation Adjustment - 0: AET value was not adjusted. - 1: AET value was adjusted to 0 mm/day (due to a negative value). - Bits 3-6: Number of Landsat observations used for this pixel (0-15). - Bit 7: SLC-Off - 0: SLC-Off was not applied. - 1: SLC-Off was applied to Landsat 7 (may contain sensor artifacts). ||||||||||||||||||||||||||||||||||||||||||||||||||||||||||||||||||||||||||||||||||||||||||||||||||||\n\n### Terms of Use\n\n**Terms of Use**\n\n[CC-BY-4.0](https://spdx.org/licenses/CC-BY-4.0.html)\n\n### Citations\n\nCitations:\n\n- Juan P. Guerschman, Tim R. McVicar, Jamie Vleeshower, Thomas G. Van Niel,\n Jorge L. Peña-Arancibia, Yun Chen. Estimating actual evapotranspiration at\n field-to-continent scales by calibrating the CMRSET algorithm with MODIS,\n VIIRS, Landsat and Sentinel-2 data, Journal of Hydrology, Volume 605, 2022,\n 127318,\n [doi:10.1016/j.jhydrol.2021.127318](https://doi.org/10.1016/j.jhydrol.2021.127318).\n\n### DOIs\n\n- \u003chttps://doi.org/10.1016/j.jhydrol.2021.127318\u003e\n\n### Explore with Earth Engine\n\n| **Important:** Earth Engine is a platform for petabyte-scale scientific analysis and visualization of geospatial datasets, both for public benefit and for business and government users. Earth Engine is free to use for research, education, and nonprofit use. To get started, please [register for Earth Engine access.](https://console.cloud.google.com/earth-engine)\n\n### Code Editor (JavaScript)\n\n```javascript\nvar dataset = ee.ImageCollection('TERN/AET/CMRSET_LANDSAT_V2_2');\n\nvar visualization = {\n bands: ['ETa'],\n min: 0,\n max: 7,\n palette: ['d7191c', 'fdae61', 'ffffbf', 'abd9e9', '2c7bb6']\n};\n\nMap.setCenter(132, -27, 4);\n\nMap.addLayer(\n dataset, visualization, 'Average daily evapotranspiration (mm/day)');\n```\n[Open in Code Editor](https://code.earthengine.google.com/?scriptPath=Examples:Datasets/TERN/TERN_AET_CMRSET_LANDSAT_V2_2) \n[Actual Evapotranspiration for Australia (CMRSET Landsat V2.2)](/earth-engine/datasets/catalog/TERN_AET_CMRSET_LANDSAT_V2_2) \nThis dataset provides accurate actual evapotranspiration (AET or ETa) for Australia using the CMRSET algorithm. The AET band (named 'ETa') contains the average daily value from the CMRSET model for all cloud-free Landsat observations in that month (indicated with value 3 in the AET Data Source QA bits). After the ... \nTERN/AET/CMRSET_LANDSAT_V2_2, agriculture,australia,csiro,evaporation,evapotranspiration,landsat-derived,tern,water-vapor \n2000-02-01T00:00:00Z/2024-06-01T00:00:00Z \n-45 110 -10 155 \nGoogle Earth Engine \nhttps://developers.google.com/earth-engine/datasets\n\n- [https://doi.org/10.1016/j.jhydrol.2021.127318](https://doi.org/https://portal.tern.org.au/actual-evapotranspiration-australia-cmrset-algorithm/21915)\n- [https://doi.org/10.1016/j.jhydrol.2021.127318](https://doi.org/https://developers.google.com/earth-engine/datasets/catalog/TERN_AET_CMRSET_LANDSAT_V2_2)"]]