- 数据集可用时间
- 2018-01-01T00:00:00Z–2019-01-01T00:00:00Z
- 数据集生产者
- 美国人口普查局
- 标签
说明
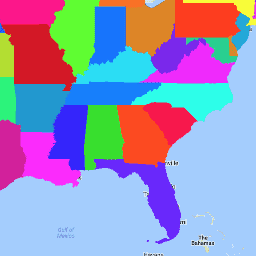
美国人口普查局 TIGER 数据集包含美国主要政府部门的 2018 年边界。除了 50 个州之外,美国人口普查局还将哥伦比亚特区、波多黎各和每个岛屿地区(美属萨摩亚、北马里亚纳群岛联邦、关岛和美属维尔京群岛)视为在数据呈现方面与州等效的地区。 每个功能都代表一个州或相当于州的状态。
如需详细了解所有 TIGER 2018 产品,请参阅 TIGER 技术文档。
表格结构
表格结构
| 名称 | 类型 | 说明 |
|---|---|---|
| ALAND | 双精度 | 陆地面积 |
| AWATER | 双精度 | 水域面积 |
| 除法 | STRING | 部门代码 |
| FUNCSTAT | STRING | 功能状态 |
| GEOID | STRING | 州标识符;州 FIPS 代码 |
| INTPTLAT | STRING | 内部点的纬度 |
| INTPTLON | STRING | 内部点经度 |
| LSAD | STRING | 相应州的法律/统计区域说明 |
| MTFCC | STRING | MAF/TIGER 地图项类别代码 (=G4000) |
| NAME | STRING | 状态名称 |
| REGION | STRING | 区域代码 |
| STATEFP | STRING | 州 FIPS 代码 |
| STATENS | STRING | 州 GNIS 代码 |
| STUSPS | STRING | 美国邮政总局州缩写 |
使用条款
使用条款
美国人口调查局通过应用编程接口 (API) 以机器可读格式提供部分公开数据。通过该 API 提供的所有内容、文档、代码和相关材料均受这些条款及条件的约束。
引用
引用:
对于因使用数据集而创建的任何报告、出版物、新数据集、衍生产品或服务,用户应引用美国人口普查局。
通过 Earth Engine 探索
代码编辑器 (JavaScript)
var dataset = ee.FeatureCollection('TIGER/2018/States');
var visParams = {
  palette: ['purple', 'blue', 'green', 'yellow', 'orange', 'red'],
  min: 500000000.0,
  max: 5e+11,
  opacity: 0.8,
};
var image = ee.Image().float().paint(dataset, 'ALAND');
Map.setCenter(-99.844, 37.649, 5);
Map.addLayer(image, visParams, 'TIGER/2018/States');
Map.addLayer(dataset, null, 'for Inspector', false);
以 FeatureView 形式直观呈现
FeatureView 是 FeatureCollection 的只读加速表示形式。如需了解详情,请访问
FeatureView 文档。
代码编辑器 (JavaScript)
var fvLayer = ui.Map.FeatureViewLayer('TIGER/2018/States_FeatureView');

var visParams = {
  opacity: 0.8,
  color: {
    property: 'ALAND',
    mode: 'linear',
    palette: ['purple', 'blue', 'green', 'yellow', 'orange', 'red'],
    min: 5e8,
    max: 5e11
  }
};

fvLayer.setVisParams(visParams);
fvLayer.setName('US census states');

Map.setCenter(-99.844, 37.649, 5);
Map.add(fvLayer);