- Disponibilidad del conjunto de datos
- 1983-01-01T00:00:00Z–2016-12-31T00:00:00Z
- Proveedor del conjunto de datos
- UCSB
- Cadencia
- 1 día
- Etiquetas
Descripción
CHC-CMIP6 se desarrolló explícitamente para respaldar el análisis de los peligros relacionados con el clima en el pasado reciente y en el futuro cercano.
Este conjunto de datos de proyecciones climáticas contiene datos globales diarios discretizados para los períodos de observación (1983-2016) y proyección (2030 y 2050) que se utilizarán en la identificación y el monitoreo de extremos hidroclimáticos. El conjunto de datos contiene cuadrículas globales diarias de alta resolución (0.05°) del producto de temperatura Climate Hazards InfraRed Temperature with Stations (CHIRTS-daily), el producto de precipitación Climate Hazards InfraRed Precipitation with Stations (CHIRPS) y la humedad relativa derivada de ERA5, a partir de los cuales se derivaron los déficits de presión de vapor (VPD) y las temperaturas máximas de bulbo húmedo y globo (WBGTmax).
Se utilizaron grandes conjuntos de CMIP6 de las situaciones socioeconómicas compartidas (SSP) 245 y 585 para desarrollar campos delta diarios de alta resolución (0.05°) para 2030 y 2050.
Para obtener más información, consulta The Climate Hazards Center (CHC) Coupled Model Intercomparison Project Phase 6 (CHC-CMIP6).
Bandas
Bandas
Tamaño de píxel: 5566 metros (todas las bandas)
| Nombre | Unidades | Mín. | Máx. | Tamaño de los píxeles | Descripción |
|---|---|---|---|---|---|
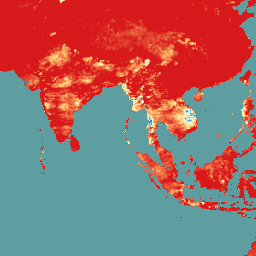
CHIRPS |
mm/d | 0 | 751.05 | 5,566 metros | Precipitación total diaria. |
himax |
°C | -49.76 | 78.56 | 5,566 metros | Índice de calor máximo diario. |
RH |
% | -1.33 | 100 | 5,566 metros | Humedad relativa |
RHx |
% | -3.11 | 100 | 5,566 metros | Humedad relativa en la hora de temperatura máxima |
RHn |
% | -2.603 | 100 | 5,566 metros | Humedad relativa en la hora de temperatura mínima. |
wbgtmax |
°C | -100.54 | 33.76 | 5,566 metros | Temperatura de globo y bulbo húmedo máxima diaria. |
vpd |
kPa | 0 | 67.98 | 5,566 metros | Déficit de presión de vapor diario. |
svp |
kPa | 0.011 | 71.41 | 5,566 metros | Es el promedio diario de la presión de vapor de saturación. |
Tmax |
°C | -43.04 | 90.52 | 5,566 metros | Temperatura máxima diaria del aire cerca de la superficie. |
Tmin |
°C | -46.72 | 89.82 | 5,566 metros | Temperatura mínima diaria del aire cerca de la superficie. |
Propiedades de imágenes
Propiedades de la imagen
| Nombre | Tipo | Descripción |
|---|---|---|
| projection_year | INT | Año de proyección |
| situación | STRING | Situaciones de las rutas socioeconómicas compartidas (SSP) |
Condiciones de Uso
Condiciones de Uso
El conjunto de datos está bajo una licencia de Creative Commons Attribution 4.0 International (CC BY 4.0). Para obtener más información, consulta The Climate Hazards Center (CHC) Coupled Model Intercomparison Project Phase 6 (CHC-CMIP6).
Citas
Williams, E., Funk, C., Peterson, P., y Tuholske, C. (2024). Observaciones y proyecciones de alta resolución sobre el cambio climático para la evaluación de extremos relacionados con el calor. Scientific Data, 11(1), 261. https://www.nature.com/articles/s41597-024-03074-w 2015.
Explora con Earth Engine
Editor de código (JavaScript)
var dataset = ee.ImageCollection('UCSB/CHC/CMIP6/v1')
                  .filter(ee.Filter.date('2016-08-01', '2016-08-30'));
var chirps = dataset.select('CHIRPS');
var chirpsVis = {
  min: 0,
  max: 100.0,
  palette: ['d7191c', 'fdae61', 'ffffbf', 'abd9e9', '2c7bb6'],
};
Map.setCenter(93.17, 10.14, 4);
Map.addLayer(chirps, chirpsVis, 'CHC CMIP6');