- זמינות קבוצת הנתונים
- 1983-01-01T00:00:00Z–2016-12-31T00:00:00Z
- מפיק מערך הנתונים
- UCSB
- קצב
- יום אחד
- תגים
תיאור
CHC-CMIP6 פותח במפורש כדי לתמוך בניתוח של סכנות שקשורות לאקלים בעבר הקרוב ובעתיד הקרוב.
קבוצת הנתונים הזו של תחזיות אקלים מכילה נתונים גלובליים יומיים על גבי רשת לתקופות התצפית (1983-2016) והתחזית (2030 ו-2050), לשימוש בזיהוי ובמעקב של אירועים קיצוניים של אקלים הידרו. קבוצת הנתונים מכילה רשתות גלובליות יומיות ברזולוציה גבוהה (0.05°) של מוצר הטמפרטורה Climate Hazards InfraRed Temperature with Stations (CHIRTS-daily), מוצר המשקעים Climate Hazards InfraRed Precipitation with Stations (CHIRPS) והלחות היחסית שנגזרת מ-ERA5, שממנה נגזרו נתוני Vapor Pressure Deficits (VPD) ו-maximum Wet Bulb Globe Temperatures (WBGTmax).
נעשה שימוש באנסמבלים גדולים של CMIP6 מתרחישי SSP (Shared Socioeconomic Pathway, מסלול חברתי-כלכלי משותף) 245 ו-SSP 585 כדי לפתח שדות דלתא יומיים ברזולוציה גבוהה (0.05°) לשנים 2030 ו-2050.
מידע נוסף זמין במאמר The Climate Hazards Center (CHC) Coupled Model Intercomparison Project Phase 6 (CHC-CMIP6).
תחום תדרים
תחום תדרים
גודל הפיקסל: 5,566 מטרים (כל הפסים)
| שם | יחידות | מינימום | מקסימום | גודל הפיקסל | תיאור |
|---|---|---|---|---|---|
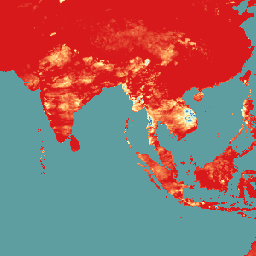
CHIRPS |
mm/d | 0 | 751.05 | 5,566 מטרים | סך המשקעים היומי. |
himax |
°C | -49.76 | 78.56 | 5,566 מטרים | מדד החום המקסימלי היומי. |
RH |
% | 1.33- | 100 | 5,566 מטרים | לחות יחסית. |
RHx |
% | -3.11 | 100 | 5,566 מטרים | הלחות היחסית בשעה שבה הטמפרטורה מקסימלית |
RHn |
% | -2.603 | 100 | 5,566 מטרים | הלחות היחסית בשעה שבה הטמפרטורה מינימלית. |
wbgtmax |
°C | -100.54 | 33.76 | 5,566 מטרים | הטמפרטורה היומית המקסימלית של מדחום כדור רטוב. |
vpd |
kPa | 0 | 67.98 | 5,566 מטרים | מחסור יומי בלחץ אדים. |
svp |
kPa | 0.011 | 71.41 | 5,566 מטרים | לחץ אדים רווי ממוצע ביום. |
Tmax |
°C | 43.04- | 90.52 | 5,566 מטרים | הטמפרטורה היומית המקסימלית של האוויר קרוב לפני השטח. |
Tmin |
°C | -46.72 | 89.82 | 5,566 מטרים | הטמפרטורה היומית המינימלית של האוויר קרוב לפני השטח. |
מאפייני תמונה
מאפייני תמונה
| שם | סוג | תיאור |
|---|---|---|
| projection_year | INT | שנת התחזית |
| תרחיש | מחרוזת | תרחישים של מסלולים חברתיים-כלכליים משותפים (SSP) |
תנאים והגבלות
תנאים והגבלות
הנתונים כפופים לרישיון Creative Commons שמותנה בייחוס 4.0 International (CC BY 4.0). מידע נוסף זמין במאמר The Climate Hazards Center (CHC) Coupled Model Intercomparison Project Phase 6 (CHC-CMIP6).
ציטוטים ביבליוגרפיים
Williams, E., פאנק, סי (Funk, C.), Peterson, P., & Tuholske, C. (2024). תצפיות ותחזיות ברזולוציה גבוהה לגבי שינויי אקלים לצורך הערכה של אירועים קיצוניים שקשורים לחום. Scientific Data, 11(1), 261. https://www.nature.com/articles/s41597-024-03074-w 2015.
סיור עם פלטפורמת Earth Engine
עורך קוד (JavaScript)
var dataset = ee.ImageCollection('UCSB/CHC/CMIP6/v1')
                  .filter(ee.Filter.date('2016-08-01', '2016-08-30'));
var chirps = dataset.select('CHIRPS');
var chirpsVis = {
  min: 0,
  max: 100.0,
  palette: ['d7191c', 'fdae61', 'ffffbf', 'abd9e9', '2c7bb6'],
};
Map.setCenter(93.17, 10.14, 4);
Map.addLayer(chirps, chirpsVis, 'CHC CMIP6');