- Доступность набора данных
- 1983-01-01T00:00:00Z–2016-12-31T00:00:00Z
- Производитель наборов данных
- UCSB
- Каденция
- 1 день
- Теги
Описание
Модель CHC-CMIP6 была специально разработана для поддержки анализа климатических опасностей за недавнее прошлое и в ближайшем будущем.
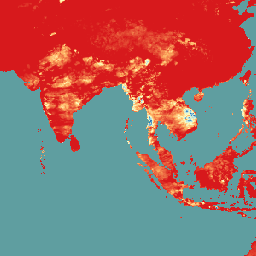
Этот набор данных по климатическим прогнозам содержит глобальные ежедневные сеточные данные за период наблюдений (1983–2016 гг.) и прогнозов (2030 и 2050 гг.), которые будут использоваться для выявления и мониторинга гидроклиматических экстремумов. Набор данных содержит глобальные ежедневные сетки высокого разрешения (0,05°) продукта температуры Climate Hazards InfraRed Temperature with Stations (CHIRTS-daily), продукта осадков Climate Hazards InfraRed Precipitation with Stations (CHIRPS) и относительной влажности, полученной из данных ERA5, на основе которых были рассчитаны дефицит давления пара (VPD) и максимальная температура влажного термометра (WBGTmax).
Для разработки ежедневных дельта-полей высокого разрешения (0,05°) на 2030 и 2050 годы были использованы большие ансамбли CMIP6 из сценариев Shared Socioeconomic Pathway (SSP) 245 и SSP 585.
Для получения дополнительной информации см. проект сравнения связанных моделей Центра по изучению климатических опасностей (CHC), этап 6 (CHC-CMIP6) .
Группы
Группы
Размер пикселя: 5566 метров (все диапазоны)
| Имя | Единицы | Мин | Макс | Размер пикселя | Описание |
|---|---|---|---|---|---|
CHIRPS | мм/д | 0 | 751.05 | 5566 метров | Суточное количество осадков. |
himax | °С | -49.76 | 78.56 | 5566 метров | Максимально допустимая суточная температура воздуха. |
RH | % | -1.33 | 100 | 5566 метров | Относительная влажность. |
RHx | % | -3.11 | 100 | 5566 метров | Относительная влажность в час максимальной температуры |
RHn | % | -2.603 | 100 | 5566 метров | Относительная влажность в час минимальной температуры. |
wbgtmax | °С | -100.54 | 33.76 | 5566 метров | Максимальная суточная температура по влажному термометру. |
vpd | кПа | 0 | 67.98 | 5566 метров | Суточный дефицит давления пара. |
svp | кПа | 0,011 | 71.41 | 5566 метров | Среднесуточное давление насыщенного пара. |
Tmax | °С | -43.04 | 90.52 | 5566 метров | Максимальная суточная температура воздуха у поверхности земли. |
Tmin | °С | -46.72 | 89.82 | 5566 метров | Минимальная суточная температура воздуха у поверхности земли. |
Свойства изображения
Свойства изображения
| Имя | Тип | Описание |
|---|---|---|
| проекционный_год | ИНТ | Прогнозный год |
| сценарий | НИТЬ | Сценарии общего социально-экономического пути (SSP) |
Условия эксплуатации
Условия эксплуатации
Данный набор данных распространяется под лицензией Creative Commons Attribution 4.0 International (CC BY 4.0). Для получения дополнительной информации см. проект сравнения связанных моделей Центра по изучению климатических опасностей (CHC), фаза 6 (CHC-CMIP6) .
Цитаты
Williams, E., Funk, C., Peterson, P., & Tuholske, C. (2024). High resolution climate change observations and projections for the evaluation of heat-related extremes. Scientific Data, 11(1), 261. https://www.nature.com/articles/s41597-024-03074-w 2015.
Исследуйте мир с помощью Earth Engine.
Редактор кода (JavaScript)
var dataset = ee.ImageCollection('UCSB/CHC/CMIP6/v1')
                  .filter(ee.Filter.date('2016-08-01', '2016-08-30'));
var chirps = dataset.select('CHIRPS');
var chirpsVis = {
  min: 0,
  max: 100.0,
  palette: ['d7191c', 'fdae61', 'ffffbf', 'abd9e9', '2c7bb6'],
};
Map.setCenter(93.17, 10.14, 4);
Map.addLayer(chirps, chirpsVis, 'CHC CMIP6');