- Dostępność zbioru danych
- 2010-01-01T00:00:00Z–2010-12-31T00:00:00Z
- Dostawca zbioru danych
- UNEP-WCMC (UN Environment Programme World Conservation Monitoring Centre)
- Tagi
Opis
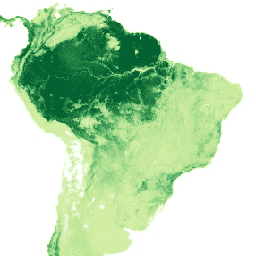
Ten zbiór danych przedstawia naziemne i podziemne zasoby węgla na lądzie (w tonach (t) węgla na hektar (ha)) z ok. 2010 roku. Zbiór danych został utworzony przez połączenie najbardziej wiarygodnych publicznie dostępnych zbiorów danych i nałożenie na nie mapy pokrycia terenu ESA CCI z 2010 roku (ESA, 2017). Każdej komórce siatki przypisano odpowiednią wartość biomasy nadziemnej z mapy biomasy, która była najbardziej odpowiednia dla typu pokrycia terenu w danej komórce siatki. Wejściowe zbiory danych o węgiel zostały wybrane na podstawie przeglądu literatury dotyczącej istniejących zbiorów danych o węgiel w biomasie w ekosystemach lądowych, opublikowanych w recenzowanych publikacjach. Aby określić, które zbiory danych połączyć w celu utworzenia mapy globalnej gęstości węgla, zidentyfikowane zbiory danych zostały ocenione na podstawie rozdzielczości, dokładności, definicji biomasy i daty odniesienia (więcej informacji o wybranych zbiorach danych znajdziesz w tabeli 1 w cytowanym artykule). Po zagregowaniu każdego wybranego zbioru danych do skali nominalnej o rozdzielczości 300 m do wyodrębnienia biomasy nadziemnej z danych Santoro i in. (2018) na obszarach leśnych wykorzystano kategorie lasów w zbiorze danych CCI ESA 2010 dotyczących pokrycia terenu. Biomasę lasów i sawann w Afryce zaczerpnęliśmy z publikacji Bouvet i wsp. z 2018 r., a biomasę obszarów poza Afryką i poza lasami – z publikacji Santoro i wsp. z 2018 r. Biomasę z klas pokrycia terenu obejmujących grunty uprawne, rzadką roślinność i trawy z CCI ESA, a także obszary zarośli poza Afryką, których brakuje w Santoro et al. 2018, wyodrębniono z Xia et al. 2014 i Spawn et al. 2017, a następnie uśredniono według strefy ekologicznej dla każdego typu pokrycia terenu. Biomasę podziemną dodano na podstawie stosunku korzeni do pędów zgodnie z wytycznymi IPCC z 2006 r. dotyczącymi krajowych inwentaryzacji gazów cieplarnianych (IPCC, 2006). Do gruntów ornych nie przypisano wartości podziemnych, ponieważ nie były dostępne współczynniki. Następnie zsumowano biomasę nadziemną i podziemną i pomnożono ją przez 0,5, aby przeliczyć ją na węgiel.W ten sposób powstała jedna warstwa węgla w biomasie nadziemnej i podziemnej. Ten zbiór danych nie został zweryfikowany.
Źródła:
- Bouvet, A. i in. 2018. Mapa biomasy nadziemnej afrykańskich sawann i lasów o rozdzielczości 25 m, uzyskana na podstawie danych z satelity ALOS PALSAR. Remote Sensing of the Environment 206, 156-173.
- ESA (2017) Land Cover CCI Product User Guide Version 2. Tech. Rep..
- IPCC (2006) 2006 IPCC guidelines for national greenhouse gas inventories (red. HS Eggleston, L Buendia, K Miwa, T Ngara, K Tanabe.) Kanagawa, Japonia: IGES.
- Santoro, M. i in. (2018). Szczegółowy obraz puli biomasy nadziemnej lasów w 2010 roku uzyskany na podstawie wielu obserwacji teledetekcyjnych. Geophysical Research Abstracts 20, EGU2018-EG18932.
- Spawn SA et al. (2017) New global biomass map for the year 2010. Nowy Orlean, Luizjana: American Geophysical Union.
- Xia, J. i in. (2014) Spatio-temporal patterns and climate variables controlling of biomass carbon stock of global grassland ecosystems from 1982 to 2006. Remote Sensing 6, 1783-1802.
Uwaga dostawcy: zbiór danych dotyczących biomasy węglowej opracowany przez Światowe Centrum Monitoringu Ochrony Przyrody Programu Narodów Zjednoczonych ds. Środowiska (UNEP-WCMC) przedstawia warunki panujące w latach 1982–2010 w zależności od rodzaju pokrycia terenu. Względne wzorce zasobów węgla są dobrze reprezentowane w tym zbiorze danych. Zbiór danych NASA/ORNL dotyczący biomasy węglowej przedstawia warunki biomasy w 2010 roku wraz z oszacowaniami niepewności na poziomie piksela. Dodatkowa biomasa niedominujących typów pokrycia terenu jest reprezentowana w każdym pikselu. Więcej informacji znajdziesz w artykułach opisujących poszczególne zbiory danych: WCMC (Soto-Navarro i in. 2020) i NASA/ORNL (Spawn i in. 2020).
Pasma
Pasma
| Nazwa | Minimum | Maks. | Rozmiar piksela | Opis |
|---|---|---|---|---|
carbon_tonnes_per_ha |
0 | 445,5 | 300 metrów | Tonaż węgla w biomasie nadziemnej i podziemnej na hektar |
Warunki korzystania z usługi
Warunki korzystania z usługi
Dane te podlegają licencji Attribution-ShareAlike 4.0 International (CC BY-SA 4.0). Szczegółowe informacje znajdziesz tutaj.
Cytaty
Soto-Navarro C., Ravilious C., Arnell A., de Lamo X., Harfoot M., Hill S. L. L., Wearn O. R., Santoro M., Bouvet A., Mermoz S., Le Toan T., Xia J., Liu S., Yuan W., Spawn S. A., Gibbs H. K., Ferrier S., Harwood T., Alkemade R., Schipper A. M., Schmidt-Traub G., Strassburg B., Miles L., Burgess N. D. i Kapos V. (2020) Mapping co-benefits for carbon storage and biodiversity to inform conservation policy and action. Philosophical Transactions of the Royal Society B. 375 Link
DOI
Odkrywanie za pomocą Earth Engine
Edytor kodu (JavaScript)
var image = ee.Image('WCMC/biomass_carbon_density/v1_0/2010');

Map.addLayer(ee.Image(1), {min: 0, max: 1}, 'base_map');
Map.addLayer(
    image, {
      min: 1,
      max: 180,
      palette: ['d9f0a3', 'addd8e', '78c679', '41ab5d', '238443', '005a32']
    },
    'carbon_tonnes_per_ha');