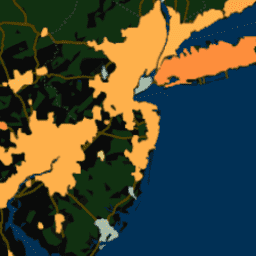
Этот набор данных содержит годовые, летние и зимние значения интенсивности городского острова тепла (SUHI) для более чем 10 000 городских кластеров по всему миру в дневное и ночное время. Набор данных был создан с использованием данных MODIS TERRA и AQUA о температуре поверхности земли (LST) за 8 дней, базы данных о протяженности городов Landscan, данных Global Multi-Responsion Terrain Elevation Data 2010 и данных о земельном покрове Европейского космического агентства (ESA) в рамках Инициативы по изменению климата (CCI) с использованием упрощенного алгоритма оценки протяженности городов. Продукт доступен как на уровне пикселей (с разрешением 300 м после уменьшения масштаба), так и в виде средних значений по городским кластерам с 2003 по 2018 год. Ежемесячные композитные данные доступны только в виде средних значений по городским кластерам.
UHI_yearly_averaged: Коллекция изображений среднегодовых кластерных составных значений дневной и ночной интенсивности SUHI с 2003 по 2018 год.
UHI_yearly_pixel: Коллекция изображений пространственно дезагрегированных (номинальный масштаб 300 м) годовой дневной и ночной интенсивности SUHI с 2003 по 2018 год.
Summer_UHI_yearly_pixel: Коллекция изображений пространственно дезагрегированных (номинальный масштаб 300 м) дневной и ночной интенсивности SUHI в летнее время с 2003 по 2018 год.
Winter_UHI_yearly_pixel: Коллекция изображений пространственно дезагрегированных (номинальный масштаб 300 м) зимних дневных и ночных интенсивностей SUHI с 2003 по 2018 год.
Чакраборти, Т. и Ли, Х. (2019). Упрощённый алгоритм для характеристики городских островов тепла на поверхности в глобальном масштабе и изучения влияния растительности на их пространственно-временную изменчивость. Международный журнал прикладных наблюдений Земли и геоинформатики, 74, 269–280. doi:10.1016/j.jag.2018.09.015
Этот набор данных содержит годовые, летние и зимние данные об интенсивности городского острова тепла (SUHI) в дневное и ночное время для более чем 10 000 городских кластеров по всему миру. Набор данных был создан с использованием данных MODIS TERRA и AQUA о температуре поверхности земли (LST) за 8 дней, базы данных о городских территориях Landscan, данных Global Multi-Resition Terrain…
Йель/YCEO/UHI/UHI_yearly_averaged/v4, климат, UHI, городской, Йельский университет
[null,null,[],[[["\u003cp\u003eThis dataset provides annual, summertime, and wintertime surface urban heat island (SUHI) intensity data for over 10,000 urban clusters globally, from 2003 to 2018.\u003c/p\u003e\n"],["\u003cp\u003eIt includes daytime and nighttime SUHI intensity at both pixel level (300m resolution) and as urban cluster means.\u003c/p\u003e\n"],["\u003cp\u003eThe dataset utilizes MODIS land surface temperature products, Landscan urban extent data, terrain elevation data, and ESA land cover data for its calculations.\u003c/p\u003e\n"],["\u003cp\u003eUsers can explore the dataset further through the Global Surface UHI Explorer web application or access it programmatically via the Earth Engine Snippet.\u003c/p\u003e\n"],["\u003cp\u003eThe dataset is available under the CC-BY-4.0 license.\u003c/p\u003e\n"]]],["This dataset provides yearly surface urban heat island (SUHI) intensity data from 2003 to 2018 for over 10,000 global urban clusters. Derived from MODIS, Landscan, and ESA data, it offers daytime and nighttime SUHI values in annual, summer, and winter composites. The dataset is available at both pixel level (300m) and as urban cluster means. It includes six components for averaged and spatially disaggregated data. You can access and visualize this data via the Earth Engine using the provided code snippets.\n"],null,["# YCEO Surface Urban Heat Islands: Spatially-Averaged Yearly Composites of Annual Daytime and Nighttime Intensity\n\nDataset Availability\n: 2003-01-01T00:00:00Z--2018-12-31T00:00:00Z\n\nDataset Provider\n:\n\n\n [Yale Center for Earth Observation (YCEO)](https://yceo.yale.edu/research/global-surface-uhi-explorer)\n\nTags\n:\n[climate](/earth-engine/datasets/tags/climate) [uhi](/earth-engine/datasets/tags/uhi) [urban](/earth-engine/datasets/tags/urban) [yale](/earth-engine/datasets/tags/yale) \n\n#### Description\n\nThis dataset contains annual, summertime, and wintertime surface urban\nheat island (SUHI) intensities for day and night for over 10,000 urban clusters\nthroughout the world. The dataset was created using the MODIS 8-day TERRA and\nAQUA land surface temperature (LST) products, the Landscan urban extent\ndatabase, the Global Multi-resolution Terrain Elevation Data 2010, and the\nEuropean Space Agency (ESA) Climate Change Initiative (CCI) land cover data\nusing the Simplified Urban-Extent Algorithm. The product is available both at\nthe pixel level (at 300 m resolution after downscaling) and as urban cluster\nmeans from 2003 to 2018. The monthly composites are only available as urban\ncluster means.\n\nA summary of older versions,\nincluding changes from the dataset created and analyzed in the originally\npublished manuscript can be found on the\n[Yale Center for Earth Observation website](https://yceo.yale.edu/research/global-surface-uhi-explorer).\nThe dataset can also be explored using the [Global Surface UHI\nExplorer web application](https://yceo.users.earthengine.app/view/uhimap).\n\nThe dataset is split into the following six components:\n\n1. **UHI_all_averaged:** Image containing cluster-mean\n composite daytime and nighttime SUHI intensity for annual, summer,\n and winter.\n\n2. **UHI_monthly_averaged:** Image containing cluster-mean\n monthly composites of daytime and nighttime SUHI intensity.\n\n3. **UHI_yearly_averaged:** Image collection of cluster-mean\n yearly composites of daytime and nighttime SUHI intensity from 2003.\n to 2018.\n\n4. **UHI_yearly_pixel:** Image collection of spatially\n disaggregated (nominal scale of 300 m) annual daytime and nighttime\n SUHI intensity from 2003 to 2018.\n\n5. **Summer_UHI_yearly_pixel:** Image collection of spatially\n disaggregated (nominal scale of 300 m) summertime daytime and\n nighttime SUHI intensity from 2003 to 2018.\n\n6. **Winter_UHI_yearly_pixel:** Image collection of spatially\n disaggregated (nominal scale of 300 m) wintertime daytime and\n nighttime SUHI intensity from 2003 to 2018.\n\nThis asset is the third component.\n\n### Bands\n\n\n**Pixel Size**\n\n300 meters\n\n**Bands**\n\n| Name | Units | Pixel Size | Description |\n|-------------|-------|------------|---------------|\n| `Daytime` | °C | meters | Daytime UHI |\n| `Nighttime` | °C | meters | Nighttime UHI |\n\n### Terms of Use\n\n**Terms of Use**\n\n[CC-BY-4.0](https://spdx.org/licenses/CC-BY-4.0.html)\n\n### Citations\n\nCitations:\n\n- Chakraborty, T., \\& Lee, X. (2019). A simplified urban-extent algorithm\n to characterize surface urban heat islands on a global scale and examine\n vegetation control on their spatiotemporal variability. International\n Journal of Applied Earth Observation and Geoinformation, 74, 269-280.\n [doi:10.1016/j.jag.2018.09.015](https://doi.org/10.1016/j.jag.2018.09.015)\n\n### Explore with Earth Engine\n\n| **Important:** Earth Engine is a platform for petabyte-scale scientific analysis and visualization of geospatial datasets, both for public benefit and for business and government users. Earth Engine is free to use for research, education, and nonprofit use. To get started, please [register for Earth Engine access.](https://console.cloud.google.com/earth-engine)\n\n### Code Editor (JavaScript)\n\n```javascript\nvar dataset = ee.ImageCollection('YALE/YCEO/UHI/UHI_yearly_averaged/v4');\n\nvar visualization = {\n bands: ['Daytime'],\n min: -1.5,\n max: 7.5,\n palette: [\n '313695', '74add1', 'fed976', 'feb24c','fd8d3c', 'fc4e2a', 'e31a1c',\n 'b10026']\n};\n\nMap.setCenter(-74.7, 40.6, 7);\n\nMap.addLayer(dataset, visualization, 'Daytime UHI');\n```\n[Open in Code Editor](https://code.earthengine.google.com/?scriptPath=Examples:Datasets/YALE/YALE_YCEO_UHI_UHI_yearly_averaged_v4) \n[YCEO Surface Urban Heat Islands: Spatially-Averaged Yearly Composites of Annual Daytime and Nighttime Intensity](/earth-engine/datasets/catalog/YALE_YCEO_UHI_UHI_yearly_averaged_v4) \nThis dataset contains annual, summertime, and wintertime surface urban heat island (SUHI) intensities for day and night for over 10,000 urban clusters throughout the world. The dataset was created using the MODIS 8-day TERRA and AQUA land surface temperature (LST) products, the Landscan urban extent database, the Global Multi-resolution Terrain ... \nYALE/YCEO/UHI/UHI_yearly_averaged/v4, climate,uhi,urban,yale \n2003-01-01T00:00:00Z/2018-12-31T00:00:00Z \n-49.98 -180 69.7 180 \nGoogle Earth Engine \nhttps://developers.google.com/earth-engine/datasets\n\n- [](https://doi.org/https://yceo.yale.edu/research/global-surface-uhi-explorer)\n- [](https://doi.org/https://developers.google.com/earth-engine/datasets/catalog/YALE_YCEO_UHI_UHI_yearly_averaged_v4)"]]