- 카탈로그 소유자
- Awesome GEE Community Catalog
- 데이터 세트 제공
- 2000-01-01T00:00:00Z–2023-12-31T00:00:00Z
- 데이터 세트 출처
- 오크리지 국립연구소
- 태그
설명
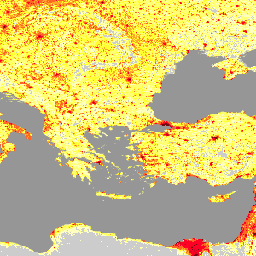
오크리지 국립 연구소 (ORNL)에서 제공하는 LandScan 데이터 세트는 다양한 애플리케이션에 유용한 리소스로 사용되는 포괄적이고 고해상도의 전 세계 인구 분포 데이터 세트를 제공합니다. 최첨단 공간 모델링 기술과 고급 지리 공간 데이터 소스를 활용하는 LandScan은 30초 해상도로 인구수와 밀도에 관한 자세한 정보를 제공하여 전 세계 인구 밀집 지역 패턴에 관한 정확하고 최신 통계를 제공합니다. LandScan은 정확성과 세부성을 바탕으로 도시 계획, 재해 대응, 역학, 환경 연구 등 다양한 분야를 지원하므로 전 세계적으로 다양한 사회적 및 환경적 문제를 이해하고 해결하려는 의사결정자와 연구자에게 필수적인 도구입니다.
대역
대역
픽셀 크기: 1,000미터 (모든 밴드)
| 이름 | 최소 | 최대 | 픽셀 크기 | 설명 |
|---|---|---|---|---|
b1 |
0* | 21171* | 1,000미터 | 예상 인구수 |
이용약관
이용약관
Landscan 데이터 세트는 크리에이티브 커먼즈 저작자 표시 4.0 국제 라이선스에 따라 라이선스가 부여됩니다. 사용자는 출처를 명확하게 표시하는 한 상업적 및 비상업적 목적으로 제한 없이 저작물을 사용, 복사, 배포, 전송, 각색할 수 있습니다.
인용
Sims, K., Reith, A., Bright, E., Kaufman, J., Pyle, J., Epting, J., Gonzales, J., Adams, D., Powell, E., Urban, M., & Rose, A. (2023). LandScan Global 2022[데이터 세트]. Oak Ridge National Laboratory. https://doi.org/10.48690/1529167
DOI
Earth Engine으로 탐색
코드 편집기(JavaScript)
var landscan_global =
    ee.ImageCollection('projects/sat-io/open-datasets/ORNL/LANDSCAN_GLOBAL');
var popcount_intervals = '<RasterSymbolizer>' +
    ' <ColorMap type="intervals" extended="false" >' +
    '<ColorMapEntry color="#CCCCCC" quantity="0" label="No Data"/>' +
    '<ColorMapEntry color="#FFFFBE" quantity="5" label="Population Count (Estimate)"/>' +
    '<ColorMapEntry color="#FEFF73" quantity="25" label="Population Count (Estimate)"/>' +
    '<ColorMapEntry color="#FEFF2C" quantity="50" label="Population Count (Estimate)"/>' +
    '<ColorMapEntry color="#FFAA27" quantity="100" label="Population Count (Estimate)"/>' +
    '<ColorMapEntry color="#FF6625" quantity="500" label="Population Count (Estimate)"/>' +
    '<ColorMapEntry color="#FF0023" quantity="2500" label="Population Count (Estimate)"/>' +
    '<ColorMapEntry color="#CC001A" quantity="5000" label="Population Count (Estimate)"/>' +
    '<ColorMapEntry color="#730009" quantity="185000" label="Population Count (Estimate)"/>' +
    '</ColorMap>' +
    '</RasterSymbolizer>';

// Define a dictionary which will be used to make legend and visualize image on
// map
var dict = {
  'names': [
    '0', '1-5', '6-25', '26-50', '51-100', '101-500', '501-2500', '2501-5000',
    '5001-185000'
  ],
  'colors': [
    '#CCCCCC', '#FFFFBE', '#FEFF73', '#FEFF2C', '#FFAA27', '#FF6625', '#FF0023',
    '#CC001A', '#730009'
  ]
};

// Create a panel to hold the legend widget
var legend = ui.Panel({style: {position: 'bottom-left', padding: '8px 15px'}});

// Function to generate the legend
function addCategoricalLegend(panel, dict, title) {
  // Create and add the legend title.
  var legendTitle = ui.Label({
    value: title,
    style: {
      fontWeight: 'bold',
      fontSize: '18px',
      margin: '0 0 4px 0',
      padding: '0'
    }
  });
  panel.add(legendTitle);

  var loading = ui.Label('Loading legend...', {margin: '2px 0 4px 0'});
  panel.add(loading);

  // Creates and styles 1 row of the legend.
  var makeRow = function(color, name) {
    // Create the label that is actually the colored box.
    var colorBox = ui.Label({
      style: {
        backgroundColor: color,
        // Use padding to give the box height and width.
        padding: '8px',
        margin: '0 0 4px 0'
      }
    });

    // Create the label filled with the description text.
    var description = ui.Label({value: name, style: {margin: '0 0 4px 6px'}});

    return ui.Panel({
      widgets: [colorBox, description],
      layout: ui.Panel.Layout.Flow('horizontal')
    });
  };

  // Get the list of palette colors and class names from the image.
  var palette = dict['colors'];
  var names = dict['names'];
  loading.style().set('shown', false);

  for (var i = 0; i < names.length; i++) {
    panel.add(makeRow(palette[i], names[i]));
  }

  Map.add(panel);
}

addCategoricalLegend(legend, dict, 'Population Count(estimate)');

Map.addLayer(
    landscan_global.sort('system:time_start')
        .first()
        .sldStyle(popcount_intervals),
    {}, 'Population Count Estimate 2000');
Map.addLayer(
    landscan_global.sort('system:time_start', false)
        .first()
        .sldStyle(popcount_intervals),
    {}, 'Population Count Estimate 2022');