- 目錄擁有者
- Awesome GEE Community Catalog
- 資料集可用性
- 2000-01-04T00:00:00Z–2025-10-07T00:00:00Z
- 資料集供應來源
- 美國國家乾旱減緩中心
- 標記
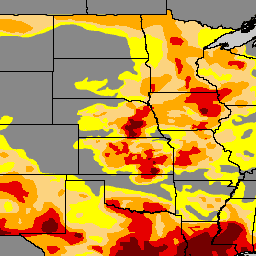
說明
美國乾旱監測圖每週四發布,顯示美國境內發生乾旱的地區。地圖採用五種分類:異常乾燥 (D0),顯示可能進入或脫離乾旱的區域,以及四種乾旱程度:中度 (D1)、嚴重 (D2)、極度 (D3) 和異常 (D4)。自 1999 年推出以來,美國乾旱監測圖一直是團隊合作的成果,由內布拉斯加大學林肯分校的國家乾旱減緩中心 (NDMC)、美國國家海洋暨大氣總署 (NOAA) 和美國農業部 (USDA) 共同製作。NDMC 負責管理乾旱監測網站和相關資料,並向 NOAA、USDA 和其他機構提供地圖和資料。可透過 droughtmonitor.unl.edu 免費取得。
錶帶
像素大小
250 公尺
波段
| 名稱 | 最小值 | 最大值 | 像素大小 | 說明 |
|---|---|---|---|---|
DM |
0 | 4 | 公尺 | 乾旱等級 |
使用條款
使用條款
這項作品已取得開放資料授權,可供使用。美國乾旱監測是由內布拉斯加大學林肯分校的國家乾旱減緩中心、美國農業部和美國國家海洋暨大氣總署共同製作。地圖由 NDMC 提供。
引用內容
參考資料:
National Drought Mitigation Center、U.S. Department of Agriculture、National Oceanic and Atmospheric Administration (2023)。美國乾旱監測圖。內布拉斯加大學林肯分校。https://droughtmonitor.unl.edu/。存取日期:2023 年 9 月 17 日
使用 Earth Engine 探索
程式碼編輯器 (JavaScript)
var usdm = ee.ImageCollection(
  "projects/sat-io/open-datasets/us-drought-monitor"
);
/*
Category	Description
DO	Abnormally Dry
D1	Moderate Drought
D2	Severe Drought
D3	Extreme Drought
D4	Exceptional Drought
*/

var usdm = ee.Image(usdm.toList(usdm.size()).get(-1));

// Define a dictionary which will be used to make legend and visualize image on map
var dict = {
  names: [
    "DO	Abnormally Dry", //1
    "D1 Moderate Drought", //2
    "D2 Severe Drought", //3
    "D3 Extreme Drought", //4
    "D4 Exceptional Drought", //5
  ],
  colors: ["FFFF00", "FCD37F", "FFAA00", "E60000", "730000"],
};

// Create a panel to hold the legend widget
var legend = ui.Panel({
  style: {
    position: "bottom-left",
    padding: "8px 15px",
  },
});

// Function to generate the legend
function addCategoricalLegend(panel, dict, title) {
  // Create and add the legend title.
  var legendTitle = ui.Label({
    value: title,
    style: {
      fontWeight: "bold",
      fontSize: "18px",
      margin: "0 0 4px 0",
      padding: "0",
    },
  });
  panel.add(legendTitle);

  var loading = ui.Label("Loading legend...", { margin: "2px 0 4px 0" });
  panel.add(loading);

  // Creates and styles 1 row of the legend.
  var makeRow = function (color, name) {
    // Create the label that is actually the colored box.
    var colorBox = ui.Label({
      style: {
        backgroundColor: color,
        // Use padding to give the box height and width.
        padding: "8px",
        margin: "0 0 4px 0",
      },
    });

    // Create the label filled with the description text.
    var description = ui.Label({
      value: name,
      style: { margin: "0 0 4px 6px" },
    });

    return ui.Panel({
      widgets: [colorBox, description],
      layout: ui.Panel.Layout.Flow("horizontal"),
    });
  };

  // Get the list of palette colors and class names from the image.
  var palette = dict["colors"];
  var names = dict["names"];
  loading.style().set("shown", false);

  for (var i = 0; i < names.length; i++) {
    panel.add(makeRow(palette[i], names[i]));
  }

  Map.add(panel);
}

/*
  // Display map and legend ///////////////////////////////////////////////////////////////////////////////
*/

// Add the legend to the map
addCategoricalLegend(legend, dict, "US Drought Monitor");

// Add USDM Image image to the map
Map.addLayer(
  usdm,
  { min: 0, max: 4, palette: dict["colors"] },
  usdm.get("system:index").getInfo()
);