
En esta página, se muestra cómo acceder a un conjunto de datos de forma programática y aplicar diseño a sus componentes, y se presentan ejemplos de aplicación de diseño a componentes de datos con geometrías de punto, polígono y polilínea.
El diseño basado en datos aplicable a conjuntos de datos renderiza componentes de datos según las coordenadas proporcionadas de latitud y longitud del archivo de datos geoespaciales que se usó para crear el conjunto de datos.
Ejemplo de aplicación de diseño a datos de punto
En este ejemplo, se muestra un enfoque para aplicar diseño a componentes de datos basados en una geometría de punto.
Acerca del conjunto de datos
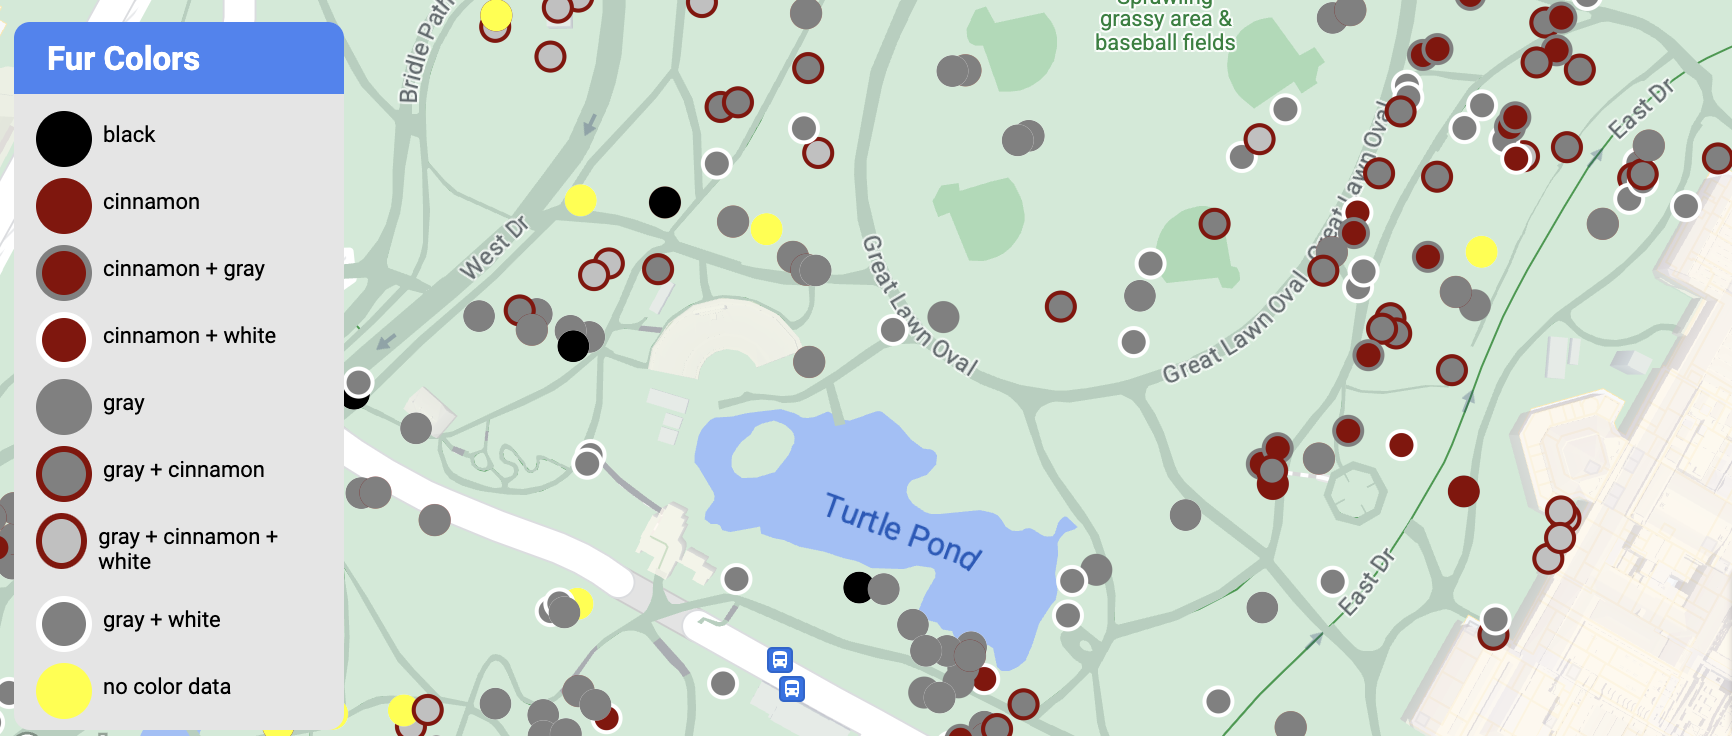
El conjunto de datos que se usa en este ejemplo es el resultado de una encuesta de 2018 sobre ardillas en Central Park, ciudad de Nueva York. En el siguiente extracto del archivo de datos CSV, las columnas x y y se usan para la ubicación geográfica. También se incluye una columna LatLng, pero no se usa en este ejemplo porque los conjuntos de datos solo admiten el formato WKT si la columna se llama WKT. Para obtener más información sobre los formatos admitidos para la ubicación, consulta Requisitos de CSV.
El conjunto de datos del censo de ardillas contiene una gran variedad de datos relacionados con el color del pelaje y el comportamiento observados (desplaza la tabla en sentido horizontal para ver todos los datos).
| X | Y | UniqueSquirrelID | Hectare | Shift | Date | Hectare SquirrelNumber | Age | PrimaryFurColor | HighlightFurColor | CombinationofPrimaryandHighlightColor | Colornotes | Location | AboveGroundSighter Measurement | SpecificLocation | Running | Chasing | Climbing | Eating | Foraging | Other Activities | Kuks | Quaas | Moans | Tailflags | Tailtwitches | Approaches | Indifferent | Runsfrom | OtherInteractions | LatLng |
|---|---|---|---|---|---|---|---|---|---|---|---|---|---|---|---|---|---|---|---|---|---|---|---|---|---|---|---|---|---|---|
| -73.9561344937861 | 40.7940823884086 | 37F-PM-1014-03 | 37F | PM | 10142018 | 3 | + | false | false | false | false | false | false | false | false | false | false | false | false | false | POINT (-73.9561344937861 40.7940823884086) | |||||||||
| -73.9688574691102 | 40.7837825208444 | 21B-AM-1019-04 | 21B | AM | 10192018 | 4 | + | false | false | false | false | false | false | false | false | false | false | false | false | false | POINT (-73.9688574691102 40.7837825208444) | |||||||||
| -73.9742811484852 | 40.775533619083 | 11B-PM-1014-08 | 11B | PM | 10142018 | 8 | Gray | Gray+ | Above Ground | 10 | false | true | false | false | false | false | false | false | false | false | false | false | false | POINT (-73.97428114848522 40.775533619083) | ||||||
| -73.9596413903948 | 40.7903128889029 | 32E-PM-1017-14 | 32E | PM | 10172018 | 14 | Adult | Gray | Gray+ | Nothing selected as Primary. Gray selected as Highlights. Made executive adjustments. | false | false | false | true | true | false | false | false | false | false | false | false | true | POINT (-73.9596413903948 40.7903128889029) | ||||||
| -73.9702676472613 | 40.7762126854894 | 13E-AM-1017-05 | 13E | AM | 10172018 | 5 | Adult | Gray | Cinnamon | Gray+Cinnamon | Above Ground | on tree stump | false | false | false | false | true | false | false | false | false | false | false | false | false | POINT (-73.9702676472613 40.7762126854894) | ||||
| -73.9683613516225 | 40.7725908847499 | 11H-AM-1010-03 | 11H | AM | 10102018 | 3 | Adult | Cinnamon | White | Cinnamon+White | false | false | false | false | true | false | false | false | false | true | false | true | false | POINT (-73.9683613516225 40.7725908847499) | ||||||
| -73.9541201789795 | 40.7931811701082 | 36H-AM-1010-02 | 36H | AM | 10102018 | 2 | Adult | Gray | Gray+ | just outside hectare | Ground Plane | FALSE | false | false | false | false | true | false | false | false | false | false | false | false | false | POINT (-73.9541201789795 40.7931811701082) |
Cómo aplicar diseño a componentes de datos de punto
En este código de ejemplo, se adopta el enfoque de aplicar diseño al color de relleno y el color de trazo de cada punto en función del atributo CombinationofPrimaryandHighlightColor, que combina los colores principal y secundario del pelaje de cada ardilla.
Kotlin
private fun styleDatasetsLayer() {

  // Create the style factory function.
  val styleFactory = FeatureLayer.StyleFactory { feature: Feature ->

      // Set default colors to to yellow and point radius to 8.
      var fillColor = Color.YELLOW
      var strokeColor = Color.YELLOW
      var pointRadius = 8F
      // Check if the feature is an instance of DatasetFeature.
      if (feature is DatasetFeature) {

        val furColors: MutableMap<String, String> = feature.getDatasetAttributes()
        // Determine CombinationofPrimaryandHighlightColor attribute.
        val furColor = furColors!!["CombinationofPrimaryandHighlightColor"]
        when (furColor) {
          "Black+" -> {
            fillColor = Color.BLACK
            strokeColor= Color.BLACK
          }
          "Cinnamon+" ->  {
            fillColor = -0x750000
            strokeColor= -0x750000
          }
          "Cinnamon+Gray" -> {
            fillColor = -0x750000
            strokeColor= -0x750000
            pointRadius = 6F
          }
          "Cinnamon+White" -> {
            fillColor = -0x750000
            strokeColor= Color.WHITE
            pointRadius = 6F
          }
          "Gray+" -> fillColor = Color.GRAY
          "Gray+Cinnamon" -> {
            fillColor = Color.GRAY
            strokeColor= -0x750000
            pointRadius = 6F
          }
          "Gray+Cinnamon, White" -> {
            fillColor = Color.LTGRAY
            strokeColor= -0x750000
            pointRadius = 6F
          }
          "Gray+White" -> {
            fillColor = Color.GRAY
            strokeColor= Color.WHITE
            pointRadius = 6F
          }
        }
        return@StyleFactory FeatureStyle.Builder()
          .fillColor(fillColor)
          .strokeColor(strokeColor)
          .pointRadius(pointRadius)
          .build()
      }
    return@StyleFactory null
  }

  // Apply the style factory function to the feature layer.
  datasetLayer?.setFeatureStyle(styleFactory)
}
Java
private void styleDatasetsLayer() {

  // Create the style factory function.
  FeatureLayer.StyleFactory styleFactory = (Feature feature) -> {

    // Check if the feature is an instance of DatasetFeature.
    if (feature instanceof DatasetFeature) {

      // Determine CombinationofPrimaryandHighlightColor attribute.
      Map<String, String> furColors = ((DatasetFeature) feature).getDatasetAttributes();
      String furColor = furColors.get("CombinationofPrimaryandHighlightColor");
      // Set default colors to to yellow and point radius to 8.
      int fillColor = Color.YELLOW;
      int strokeColor = Color.YELLOW;
      int pointRadius = 8;
      switch (furColor) {
        case "Black+":
          fillColor = Color.BLACK;
          strokeColor = Color.BLACK;
          break;
        case "Cinnamon+":
          fillColor = 0xff8b0000;
          strokeColor = 0xff8b0000;
          break;
        case "Cinnamon+Gray":
          fillColor = 0xff8b0000;
          strokeColor = Color.GRAY;
          pointRadius = 6;
          break;
        case "Cinnamon+White":
          fillColor = 0xff8b0000;
          strokeColor = Color.WHITE;
          pointRadius = 6;
          break;
        case "Gray+":
          fillColor = Color.GRAY;
          strokeColor = Color.GRAY;
          break;
        case "Gray+Cinnamon":
          fillColor = Color.GRAY;
          strokeColor = 0xff8b0000;
          pointRadius = 6;
          break;
        case "Gray+Cinnamon, White":
          fillColor = Color.LTGRAY;
          strokeColor = 0xff8b0000;
          pointRadius = 6;
          break;
        case "Gray+White":
          fillColor = Color.GRAY;
          strokeColor = Color.WHITE;
          pointRadius = 6;
          break;
        default:
          fillColor = Color.YELLOW;
          strokeColor = Color.YELLOW;
          pointRadius = 8;
      }
      return new FeatureStyle.Builder()
        .fillColor(fillColor)
        .strokeColor(strokeColor)
        .pointRadius(pointRadius)
        .build();
    }
    return null;
  };

  // Apply the style factory function to the feature layer.
  datasetLayer.setFeatureStyle(styleFactory);
}
Ejemplo de aplicación de diseño a datos de polígono
En este ejemplo, se muestra un enfoque para aplicar diseño a componentes de datos basados en una geometría de polígono.

Acerca del conjunto de datos
El conjunto de datos que se usa en este ejemplo representa los parques de la ciudad de Nueva York. En el siguiente extracto del archivo GeoJSON del conjunto de datos, se muestra una entrada de componente representativa.
{
  "type": "Feature",
  "properties": {
    "jurisdiction": "DPR",
    "mapped": "False",
    "zipcode": "11356",
    "acres": "0.05",
    "location": "College Pl., College Pt. Blvd., bet. 11 Ave. and 12 Ave.",
    "nys_assembly": "27",
    "councildistrict": "19",
    "url": "http://www.nycgovparks.org/parks/Q042/",
    "typecategory": "Triangle/Plaza",
    "us_congress": "14",
    "eapply": "Poppenhusen Park",
    "parentid": "Q-07",
    "gispropnum": "Q042",
    "retired": "false",
    "communityboard": "407",
    "objectid": "6248",
    "globalid": "F4810079-CBB9-4BE7-BBFA-B3C0C35D5DE5",
    "name311": "Poppenhusen Park",
    "department": "Q-07",
    "pip_ratable": "true",
    "subcategory": "Sitting Area/Triangle/Mall",
    "precinct": "109",
    "permit": "true",
    "acquisitiondate": null,
    "omppropid": "Q042",
    "gisobjid": "100000301",
    "signname": "Poppenhusen Park",
    "address": null,
    "permitparent": "Q-07",
    "class": "PARK",
    "nys_senate": "11",
    "permitdistrict": "Q-07",
    "borough": "Q",
    "waterfront": "false"
  },
  "geometry": {
    "type": "MultiPolygon",
    "coordinates": [
      [
        [
          [
            -73.84575702371716,
            40.78796240884273
          ],
          [
            -73.84593393292693,
            40.78796857347548
          ],
          [
            -73.84577256469657,
            40.787651355629556
          ],
          [
            -73.84575702371716,
            40.78796240884273
          ]
        ]
      ]
    ]
  }
},
Cómo aplicar diseño a componentes de datos de polígono
El código de este ejemplo aplica colores especiales a los componentes de datos asociados con un atributo typecategory de "Undeveloped" o "Parkway", y pinta de color verde todos los demás componentes.
Kotlin
private fun styleDatasetsLayer() {

    // Create the style factory function.
    val styleFactory = FeatureLayer.StyleFactory { feature: Feature ->

        // Check if the feature is an instance of DatasetFeature.
        if (feature is DatasetFeature) {
          // Determine the value of the typecategory attribute.
          val typeCategories: MutableMap<String, String> = feature.getDatasetAttributes()
          val typeCategory = typeCategories!!["typecategory"]
          // Set default colors to green.
          var fillColor = 0x4000ff00
          var strokeColor = 0xff00ff00
          when (typeCategory) {
            "Undeveloped" -> {
              // Color undeveloped areas blue.
              fillColor = 0x400000ff
              strokeColor = 0x400000ff
            }
            "Parkway" -> {
              // Color parkway areas red.
              fillColor = 0x40ff0000
              strokeColor = 0x40ff0000
            }
            else -> {
              // Color all other areas green.
              fillColor = 0x4000ff00
              strokeColor = 0xff00ff00
            }
          }
          return@StyleFactory FeatureStyle.Builder()
            .fillColor(fillColor)
            .strokeColor(strokeColor)
            .strokeWidth(2F)
            .build()
        }
        return@StyleFactory null
    }

    // Apply the style factory function to the feature layer.
    datasetLayer?.setFeatureStyle(styleFactory)
}
Java
private void styleDatasetsLayer() {

    // Create the style factory function.
    FeatureLayer.StyleFactory styleFactory = (Feature feature) -> {

      // Check if the feature is an instance of DatasetFeature.
      if (feature instanceof DatasetFeature) {

        // Determine the value of the typecategory attribute.
        Map<String, String> typeCategories = ((DatasetFeature) feature).getDatasetAttributes();
        String typeCategory = typeCategories.get("typecategory");
        // Set default colors to green.
        int fillColor = 0x4000ff00;
        int strokeColor = 0xff00ff00;
        switch (typeCategory) {
          case "Undeveloped":
            // Color undeveloped areas blue.
            fillColor = 0x400000ff;
            strokeColor = 0xff0000ff;
            break;
          case "Parkway":
            // Color parkway areas red.
            fillColor = 0x40ff0000;
            strokeColor = 0xffff0000;
            break;
          default:
            // Color all other areas green.
            fillColor = 0x4000ff00;
            strokeColor = 0xff00ff00;
        }
        return new FeatureStyle.Builder()
          .fillColor(fillColor)
          .strokeColor(strokeColor)
          .strokeWidth(2)
          .build();
      }
      return null;
    };

    // Apply the style factory function to the feature layer.
    datasetLayer.setFeatureStyle(styleFactory);
}
Ejemplo de aplicación de diseño a datos de polilínea
En este ejemplo, se muestra un enfoque para aplicar diseño a componentes de datos basados en una geometría de polilínea.

Acerca del conjunto de datos
El conjunto de datos que se usa en este ejemplo muestra los puentes en el área de Seattle. En el siguiente extracto del archivo GeoJSON del conjunto de datos, se muestra una entrada de componente representativa.
{
  "type": "Feature",
  "properties": {
      "OBJECTID": 1,
      "COMPTYPE": 66,
      "COMPKEY": 515774,
      "HANSEGKEY": 489781,
      "UNITID": "BRG-935",
      "UNITTYPE": " ",
      "BRGUNITID": "BRG-935",
      "UNITDESC_BRG": "YALE AVE BR REV LANE OC                                                                                                                                                                                                                                        ",
      "UNITDESC_SEG": "HOWELL ST ON RP BETWEEN HOWELL ST AND I5 SB                                                                                                                                                                                                                    ",
      "INSTDATE": null,
      "EXPDATE": null,
      "STATUS": " ",
      "STATUSDT": null,
      "CONDITION": " ",
      "CONDDT": null,
      "OWN": " ",
      "LSTVERIFY": null,
      "MAINTBY": " ",
      "ADDBY": "GARCIAA",
      "ADDDTTM": "2010-01-21T00:00:00Z",
      "MODBY": null,
      "MODDTTM": null,
      "BR_NBR": 935,
      "BR_CODE": " 935",
      "BR_TYPE": "ST",
      "BR_NAME": "YALE AVE BR REV LANE OC",
      "BR_FACILITIES": "YALE AVE-SR 5 ON RAMP",
      "BR_FEATURES": "SR 5 REV LANE",
      "BR_RATING": 0,
      "BR_INSET": 1,
      "BR_GEO": "DT",
      "BR_OWNER": "DOT",
      "BR_OWNER_NAME": "State of Washington",
      "GEOBASID": 0,
      "XGEOBASID": 0,
      "GISSEGKEY": 489781,
      "EARTHQUAKE_RESPONSE_TEAM": " ",
      "SHAPE_Length": 220.11891836147655
  },
  "geometry": {
      "type": "LineString",
      "coordinates": [
          [
              -122.329201929090928,
              47.616910448708538
          ],
          [
              -122.329206483407461,
              47.616976719821004
          ],
          [
              -122.32921802149356,
              47.617042137515213
          ],
          [
              -122.329236413912909,
              47.617105967923777
          ],
          [
              -122.329261454336034,
              47.617167494985758
          ],
          [
              -122.329292861855023,
              47.617226028479571
          ],
          [
              -122.329330284134699,
              47.617280911766009
          ],
          [
              -122.329373301365223,
              47.617331529154569
          ],
          [
              -122.329421430971635,
              47.617377312810319
          ],
          [
              -122.329474133027375,
              47.617417749124023
          ],
          [
              -122.32953081631139,
              47.617452384473893
          ]
      ]
  }
},
Cómo aplicar diseño a componentes de datos de polilínea
El siguiente fragmento aplica el mismo diseño directamente a todos los componentes de datos.
Kotlin
private fun styleDatasetsLayer() {

  // Create the style factory function.
  val styleFactory = FeatureLayer.StyleFactory { feature: Feature ->

    // Check if the feature is an instance of DatasetFeature.
    if (feature is DatasetFeature) {

      return@StyleFactory FeatureStyle.Builder()
        // Define a style with green stroke with a width of 4.
        .strokeColor(0xff00ff00.toInt())
        .strokeWidth(4F)
        .build()
    }
    return@StyleFactory null
  }

  // Apply the style factory function to the feature layer.
  datasetLayer?.setFeatureStyle(styleFactory)
}
Java
private void styleDatasetsLayer() {

  // Create the style factory function.
  FeatureLayer.StyleFactory styleFactory = (Feature feature) -> {

    // Check if the feature is an instance of DatasetFeature.
    if (feature instanceof DatasetFeature) {

      return new FeatureStyle.Builder()
        // Define a style with green stroke with a width of 4.
        .strokeColor(0xff00ff00)
        .strokeWidth(4)
        .build();
    }
    return null;
  };

  // Apply the style factory function to the feature layer.
  datasetLayer.setFeatureStyle(styleFactory);
}