ภาพรวม
จัดทุกอย่างให้เป็นระเบียบอยู่เสมอด้วยคอลเล็กชัน
บันทึกและจัดหมวดหมู่เนื้อหาตามค่ากำหนดของคุณ
การจัดรูปแบบตามข้อมูลสำหรับชุดข้อมูลช่วยให้คุณอัปโหลดชุดข้อมูลเชิงพื้นที่ของคุณเอง
ใช้การจัดรูปแบบที่กำหนดเองกับฟีเจอร์ข้อมูล และแสดงฟีเจอร์ข้อมูลเหล่านั้นบน
แผนที่ได้ การจัดรูปแบบตามข้อมูลสำหรับชุดข้อมูลช่วยให้คุณสร้างการแสดงข้อมูลผ่านภาพ
ตามรูปทรงเรขาคณิตของจุด เส้น และรูปหลายเหลี่ยม รวมถึงทำให้ฟีเจอร์ข้อมูลตอบสนอง
ต่อเหตุการณ์การแตะได้ ระบบรองรับการจัดรูปแบบตามข้อมูลสำหรับชุดข้อมูลในแผนที่เวกเตอร์เท่านั้น (ต้องระบุรหัสแผนที่)
เริ่มต้นใช้งานการจัดรูปแบบตามข้อมูลสำหรับชุดข้อมูล
เพิ่มชุดข้อมูลภูมิสารสนเทศที่กำหนดเอง
เพิ่มข้อมูลที่กำหนดเองโดยใช้ Google Cloud Console หรือ Google Cloud Shell ชุดข้อมูลแต่ละชุดจะมีรหัสที่ไม่ซ้ำกัน ซึ่งคุณสามารถเชื่อมโยงกับรูปแบบแผนที่ได้
ระบบรองรับรูปแบบข้อมูลต่อไปนี้
- GeoJSON
- คั่นด้วยคอมมา (CSV)
- KML
โปรดดูรายละเอียดเกี่ยวกับข้อกำหนดและข้อจำกัดของชุดข้อมูลที่หัวข้อ
สร้างและจัดการชุดข้อมูล
เกี่ยวกับชุดข้อมูลสาธารณะ
หากต้องการจัดรูปแบบชุดข้อมูล คุณต้องเชื่อมโยงรูปแบบแผนที่กับรหัสแผนที่ ซึ่งจะเชื่อมโยงชุดข้อมูลกับรหัสแผนที่ด้วย ในแอป นักพัฒนาแอปสามารถอ้างอิงรหัสแผนที่นั้น รวมถึงรูปแบบแผนที่และข้อมูลเชิงพื้นที่ที่เชื่อมโยงกับรหัสแผนที่ ไม่มี
การควบคุมการเข้าถึงเพิ่มเติมกับข้อมูลเชิงพื้นที่ ซึ่งทําให้
ข้อมูลเชิงพื้นที่พร้อมใช้งานต่อสาธารณะอย่างมีประสิทธิภาพสําหรับทุกคนที่มีแอป
ฟีเจอร์ข้อมูลสไตล์
เมื่ออัปโหลดข้อมูลที่กำหนดเองและเชื่อมโยงกับรูปแบบแผนที่และรหัสแผนที่แล้ว คุณจะจัดรูปแบบฟีเจอร์ข้อมูลเพื่อสร้างผลลัพธ์ที่มองเห็นได้ และทำให้ฟีเจอร์ตอบสนองต่อเหตุการณ์การแตะได้
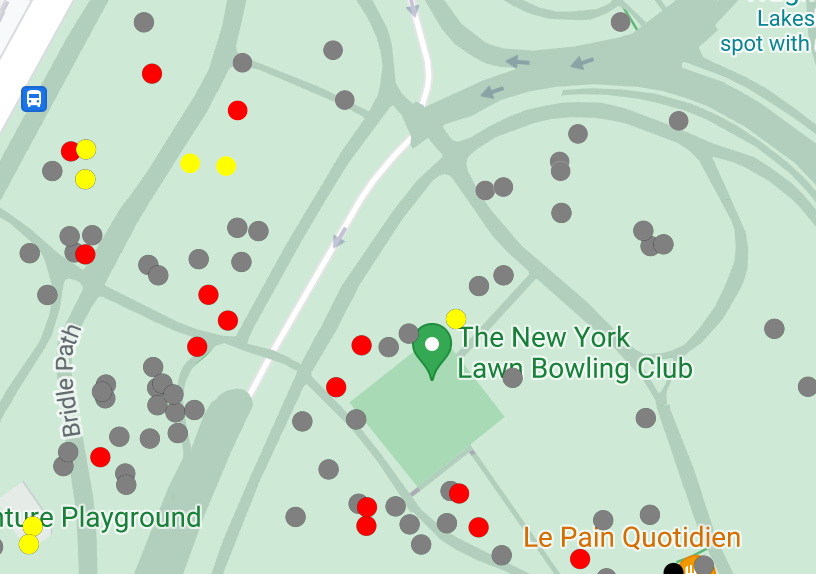
จัดรูปแบบข้อมูลจุดเพื่อแสดงตำแหน่งที่เฉพาะเจาะจงบนแผนที่
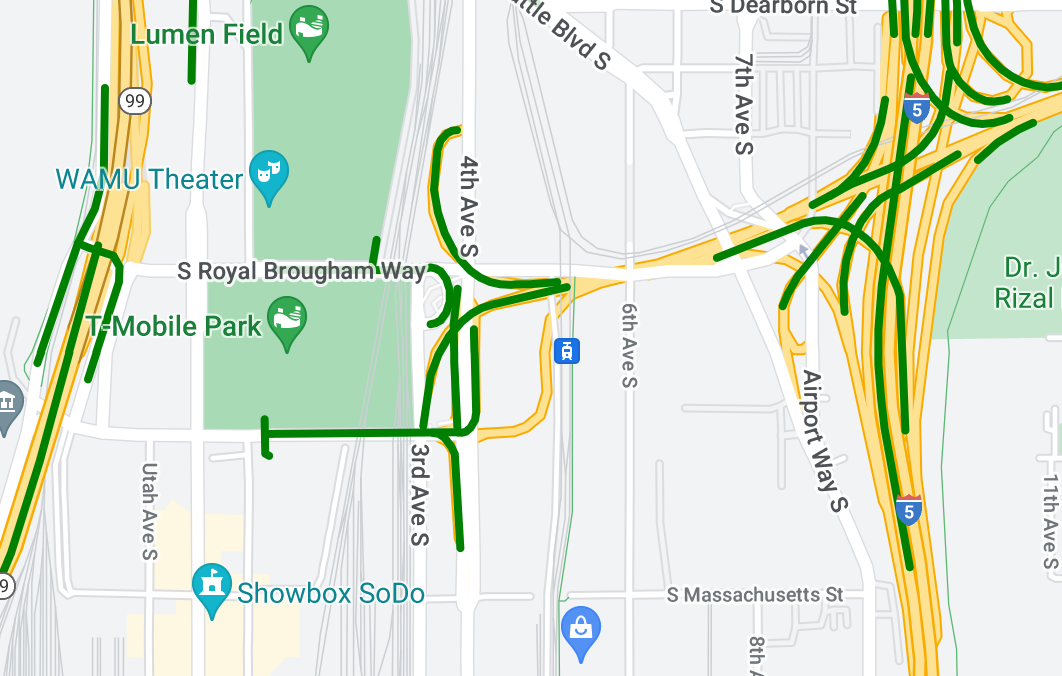
จัดรูปแบบข้อมูลเส้นหลายเส้นเพื่อไฮไลต์ลักษณะทางภูมิศาสตร์
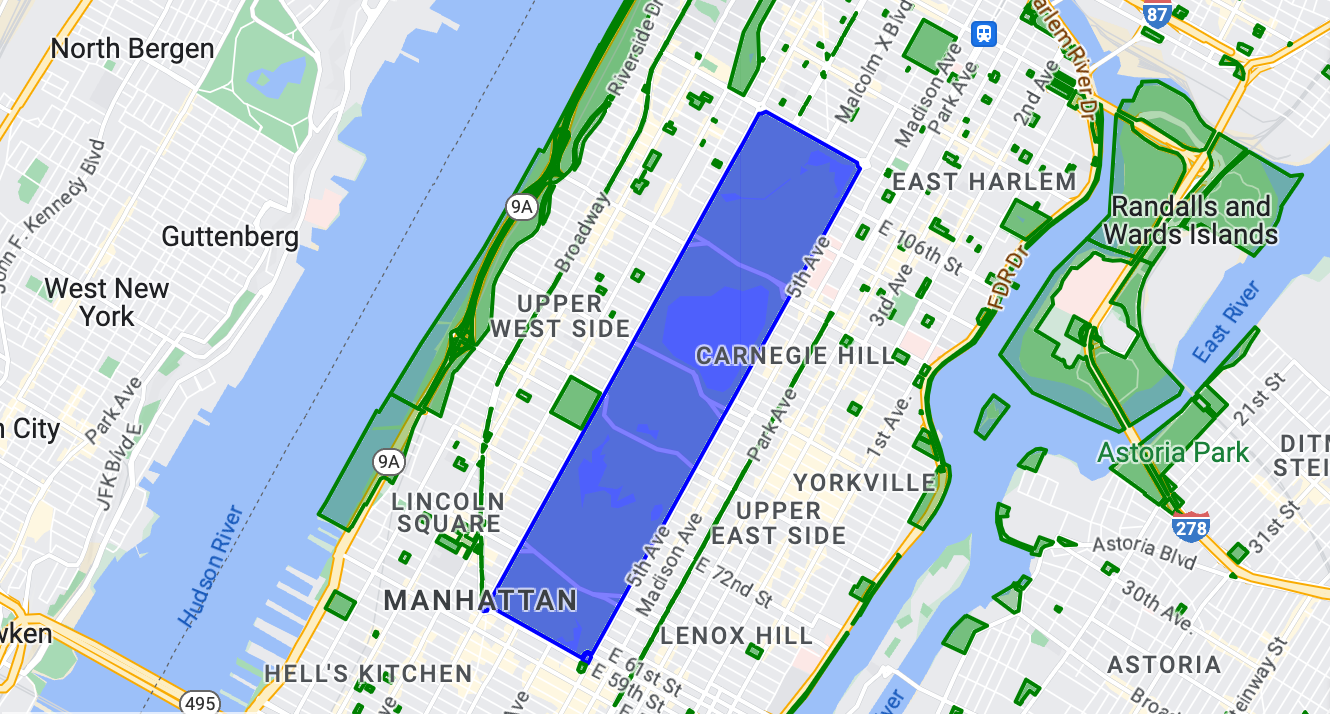
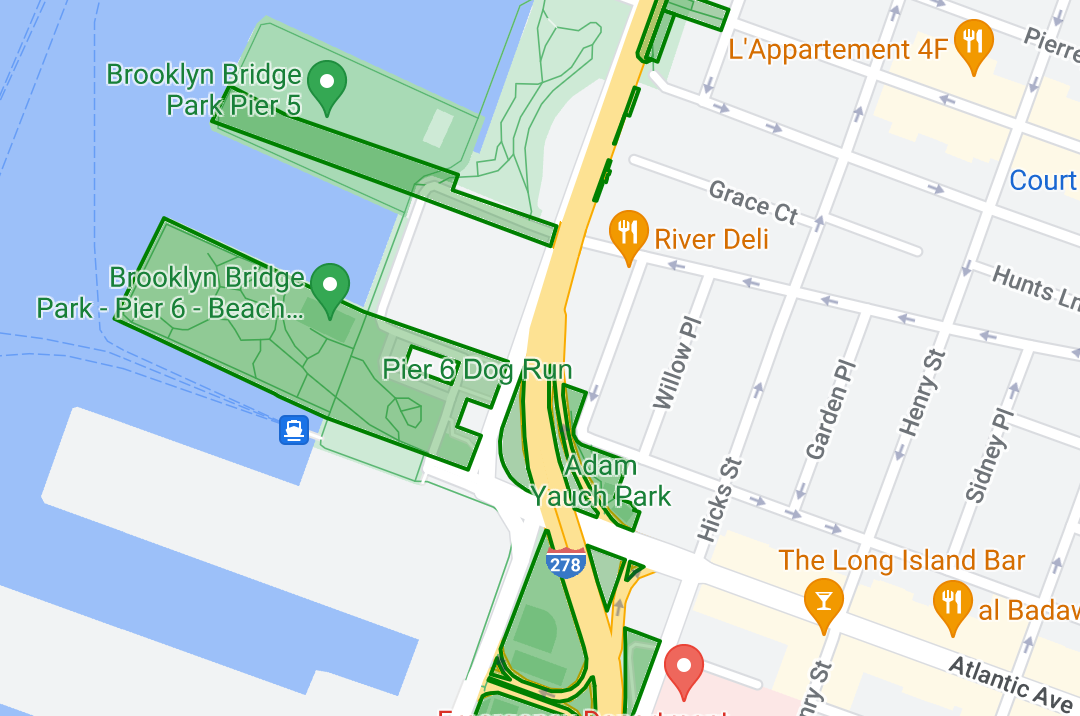
จัดรูปแบบข้อมูลรูปหลายเหลี่ยมเพื่อไฮไลต์พื้นที่ทางภูมิศาสตร์
ทําให้ฟีเจอร์ข้อมูลตอบสนองต่อเหตุการณ์การแตะโดยการเพิ่มเครื่องฟังเหตุการณ์
เนื้อหาของหน้าเว็บนี้ได้รับอนุญาตภายใต้ใบอนุญาตที่ต้องระบุที่มาของครีเอทีฟคอมมอนส์ 4.0 และตัวอย่างโค้ดได้รับอนุญาตภายใต้ใบอนุญาต Apache 2.0 เว้นแต่จะระบุไว้เป็นอย่างอื่น โปรดดูรายละเอียดที่นโยบายเว็บไซต์ Google Developers Java เป็นเครื่องหมายการค้าจดทะเบียนของ Oracle และ/หรือบริษัทในเครือ
อัปเดตล่าสุด 2025-08-31 UTC
[null,null,["อัปเดตล่าสุด 2025-08-31 UTC"],[[["\u003cp\u003eData-driven styling allows you to upload custom geospatial datasets (GeoJSON, CSV, KML) and visualize them on vector maps with custom styles based on their geometries.\u003c/p\u003e\n"],["\u003cp\u003eYou can apply unique styling to point, polyline, and polygon data, enabling visualization of locations, geographical features, and areas, respectively.\u003c/p\u003e\n"],["\u003cp\u003eDatasets associated with map IDs are effectively public, accessible to anyone with the app referencing that ID.\u003c/p\u003e\n"],["\u003cp\u003eData features can be made interactive by adding event listeners, allowing them to respond to user interactions like taps.\u003c/p\u003e\n"],["\u003cp\u003eTo get started, you'll need to upload your data using Google Cloud Console or Google Cloud Shell and then associate it with a map style and ID.\u003c/p\u003e\n"]]],[],null,["Select platform: [Android](/maps/documentation/android-sdk/dds-datasets/overview \"View this page for the Android platform docs.\") [iOS](/maps/documentation/ios-sdk/dds-datasets/overview \"View this page for the iOS platform docs.\") [JavaScript](/maps/documentation/javascript/dds-datasets/overview \"View this page for the JavaScript platform docs.\")\n\n\u003cbr /\u003e\n\nData-driven styling for datasets lets you upload your own geospatial datasets,\napply custom styling to their data features, and display those data features on\nmaps. With data-driven styling for datasets, you can create data visualizations\nbased on point, polyline, and polygon geometries, and make data features respond\nto tap events. Data-driven styling for datasets is supported on vector maps\nonly (a map ID is required).\n\n[Get started with data-driven styling for datasets](/maps/documentation/ios-sdk/dds-datasets/start)\n\nAdd custom geospatial datasets\n\nAdd your custom data using Google Cloud Console or Google Cloud\nShell. Each dataset has a unique ID, which you can associate with a map style.\nThe following data formats are supported:\n\n- GeoJSON\n- Comma-separated (CSV)\n- KML\n\nFor details about dataset requirements and limitations, see\n[Create and manage a dataset](/maps/documentation/ios-sdk/dds-datasets/create-dataset#dataset-prerequisites)\n\nAbout public datasets\n\nIn order to style a dataset you must associate a map style with a map ID, which\nalso associates the dataset to the map ID. In an app, developers can reference\nthat map ID, and any map style and geospatial data associated with it. No\nadditional access control is applied to the geospatial data, making the\ngeospatial data effectively publicly available to anyone with the app.\n\nStyle data features\n\nOnce your custom data has been uploaded and associated to a map\nstyle and map ID, you can style data features for visual impact, and make\nfeatures respond to tap events.\n\nStyle point data to show specific locations on the map.\n\nStyle polyline data to highlight geographical features.\n\nStyle polygon data to highlight geographical areas.\n\nMake data features respond to tap events by adding an event\nlistener."]]