このページでは、プログラマティックにデータセットにアクセスして対象物をスタイル設定する方法を、ポイント、ポリゴン、ポリラインの各ジオメトリごとの例を通じて説明します。
データセット用データドリブン スタイル設定では、データセットの作成に使用された地理空間データファイルで指定される緯度と経度の座標をもとに、データ対象物をレンダリングします。
ポイントデータのスタイル設定例
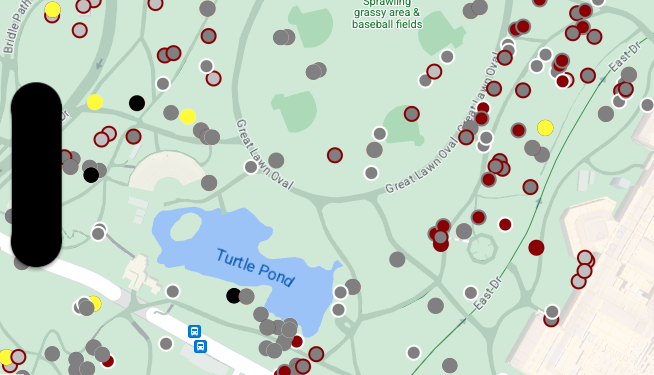
この例では、ポイント ジオメトリ ベースのデータ対象物をスタイル設定する際のアプローチを示します。

データセットについて
この例で使用しているデータセットは、ニューヨーク市のセントラル パークで 2018 年に実施されたリスについての調査の結果です。次の CSV データファイルの抜粋からわかるとおり、地理情報としては「x」および「y」列が使用されています。「LatLng」という列も存在しますが、列の名前が WKT の場合、データセットでは WKT 形式のみサポートされるため、この例では使用されません。サポートされる位置情報の形式について詳しくは、CSV の要件をご覧ください。
リスの調査のデータセットには、観察されたリスの体色や行動に関する多種多様なデータポイントが含まれています(ぜひ水平スクロールして全体を眺めてください)。
| X | Y | UniqueSquirrelID | Hectare | Shift | Date | Hectare SquirrelNumber | Age | PrimaryFurColor | HighlightFurColor | CombinationofPrimaryandHighlightColor | Colornotes | Location | AboveGroundSighter Measurement | SpecificLocation | Running | Chasing | Climbing | Eating | Foraging | Other Activities | Kuks | Quaas | Moans | Tailflags | Tailtwitches | Approaches | Indifferent | Runsfrom | OtherInteractions | LatLng |
|---|---|---|---|---|---|---|---|---|---|---|---|---|---|---|---|---|---|---|---|---|---|---|---|---|---|---|---|---|---|---|
| -73.9561344937861 | 40.7940823884086 | 37F-PM-1014-03 | 37F | PM | 10142018 | 3 | + | false | false | false | false | false | false | false | false | false | false | false | false | false | POINT (-73.9561344937861 40.7940823884086) | |||||||||
| -73.9688574691102 | 40.7837825208444 | 21B-AM-1019-04 | 21B | AM | 10192018 | 4 | + | false | false | false | false | false | false | false | false | false | false | false | false | false | POINT (-73.9688574691102 40.7837825208444) | |||||||||
| -73.9742811484852 | 40.775533619083 | 11B-PM-1014-08 | 11B | PM | 10142018 | 8 | Gray | Gray+ | Above Ground | 10 | false | true | false | false | false | false | false | false | false | false | false | false | false | POINT (-73.97428114848522 40.775533619083) | ||||||
| -73.9596413903948 | 40.7903128889029 | 32E-PM-1017-14 | 32E | PM | 10172018 | 14 | Adult | Gray | Gray+ | Nothing selected as Primary. Gray selected as Highlights. Made executive adjustments. | false | false | false | true | true | false | false | false | false | false | false | false | true | POINT (-73.9596413903948 40.7903128889029) | ||||||
| -73.9702676472613 | 40.7762126854894 | 13E-AM-1017-05 | 13E | AM | 10172018 | 5 | Adult | Gray | Cinnamon | Gray+Cinnamon | Above Ground | on tree stump | false | false | false | false | true | false | false | false | false | false | false | false | false | POINT (-73.9702676472613 40.7762126854894) | ||||
| -73.9683613516225 | 40.7725908847499 | 11H-AM-1010-03 | 11H | AM | 10102018 | 3 | Adult | Cinnamon | White | Cinnamon+White | false | false | false | false | true | false | false | false | false | true | false | true | false | POINT (-73.9683613516225 40.7725908847499) | ||||||
| -73.9541201789795 | 40.7931811701082 | 36H-AM-1010-02 | 36H | AM | 10102018 | 2 | Adult | Gray | Gray+ | just outside hectare | Ground Plane | FALSE | false | false | false | false | true | false | false | false | false | false | false | false | false | POINT (-73.9541201789795 40.7931811701082) |
ポイントデータ対象物のスタイル設定
この例のコードでは、CombinationofPrimaryandHighlightColor 属性(各個体の 1 次体色と 2 次体色をまとめたデータ)をもとに各ポイントの塗りつぶし色とストローク色を決めるスタイル設定を行っています。
Swift
let mapView = GMSMapView(frame: .zero, mapID: GMSMapID(identifier: "YOUR_MAP_ID"), camera: GMSCameraPosition(latitude: 40.7, longitude: -74.0, zoom: 12))

let layer = mapView.datasetFeatureLayer(of: "YOUR_DATASET_ID")

// Define a point style with fill and radius.
// Apply the style to the datasets features.
layer.style = { feature in
    switch(feature.datasetAttributes["CombinationofPrimaryandHighlightColor"]){
      case "Black+"  :
        let style = MutableFeatureStyle()
        style.fillColor = .black;
        style.pointRadius = 8;
        return style
      case "Cinnamon+"  :
        let style = MutableFeatureStyle()
        style.fillColor = UIColor(red: 139/255, green: 0, blue: 0, alpha: 1);
        style.pointRadius = 8;
        return style
      ...
      default :
        let style = MutableFeatureStyle()
        style.fillColor = .yellow;
        style.pointRadius = 8;
        return style
    }
}
Objective-C
GMSMapView *mapView = [GMSMapView mapWithFrame:CGRectZero mapID:[GMSMapID mapIDWithIdentifier:@"MAP_ID"] camera:[GMSCameraPosition cameraWithLatitude: 40.7 longitude: -74.0 zoom:12]];

GMSDatasetFeatureLayer *layer = [mapView datasetFeatureLayerOfDatasetID:@"YOUR_DATASET_ID"];

// Define a point style with fill and radius.
// Apply the style to the datasets features.
layer.style = ^(GMSDatasetFeature *feature) {
  NSString *attrib = feature.datasetAttributes[@"CombinationofPrimaryandHighlightColor"];
  if ([attrib isEqualToString:@"Black+"])  {
    GMSMutableFeatureStyle *style = [GMSMutableFeatureStyle style];
    style.fillColor = [UIColor blackColor];
    style.pointRadius = 8;
    return style;
  } else if([attrib isEqualToString:@"Cinnamon+"]) {
    GMSMutableFeatureStyle *style = [GMSMutableFeatureStyle style];
    style.fillColor = [UIColor colorWithRed:139.0f/255.0f
                                      green:0.0f
                                        blue:0.0f
                                      alpha:1.0f];
    style.pointRadius = 8;
    return style;
  }
  ...
  else {
    GMSMutableFeatureStyle *style = [GMSMutableFeatureStyle style];
    style.fillColor = [UIColor yellowColor];
    style.pointRadius = 8;
    return style;
  }
};
ポリゴンデータのスタイル設定例
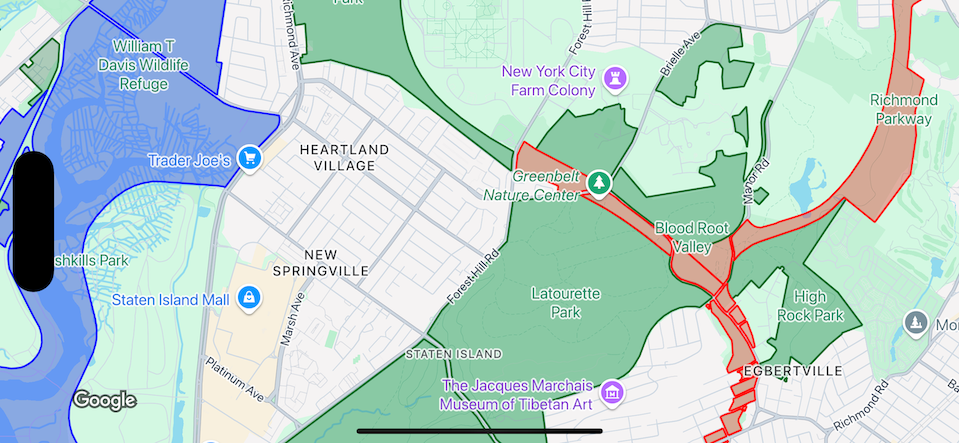
この例では、ポリゴン ジオメトリ ベースのデータ対象物をスタイル設定する際のアプローチを示します。

データセットについて
この例で使用しているのは、ニューヨーク市内の公園を示したデータセットです。次のコードは、データセットの GeoJSON ファイルから、代表的な対象物エントリを 1 つ抜粋したものです。
{
  "type": "Feature",
  "properties": {
    "jurisdiction": "DPR",
    "mapped": "False",
    "zipcode": "11356",
    "acres": "0.05",
    "location": "College Pl., College Pt. Blvd., bet. 11 Ave. and 12 Ave.",
    "nys_assembly": "27",
    "councildistrict": "19",
    "url": "http://www.nycgovparks.org/parks/Q042/",
    "typecategory": "Triangle/Plaza",
    "us_congress": "14",
    "eapply": "Poppenhusen Park",
    "parentid": "Q-07",
    "gispropnum": "Q042",
    "retired": "false",
    "communityboard": "407",
    "objectid": "6248",
    "globalid": "F4810079-CBB9-4BE7-BBFA-B3C0C35D5DE5",
    "name311": "Poppenhusen Park",
    "department": "Q-07",
    "pip_ratable": "true",
    "subcategory": "Sitting Area/Triangle/Mall",
    "precinct": "109",
    "permit": "true",
    "acquisitiondate": null,
    "omppropid": "Q042",
    "gisobjid": "100000301",
    "signname": "Poppenhusen Park",
    "address": null,
    "permitparent": "Q-07",
    "class": "PARK",
    "nys_senate": "11",
    "permitdistrict": "Q-07",
    "borough": "Q",
    "waterfront": "false"
  },
  "geometry": {
    "type": "MultiPolygon",
    "coordinates": [
      [
        [
          [
            -73.84575702371716,
            40.78796240884273
          ],
          [
            -73.84593393292693,
            40.78796857347548
          ],
          [
            -73.84577256469657,
            40.787651355629556
          ],
          [
            -73.84575702371716,
            40.78796240884273
          ]
        ]
      ]
    ]
  }
},
ポリゴンデータ対象物のスタイル設定
この例のコードでは、typecategory 属性「Undeveloped」または「Parkway」と関連付けられたデータ対象物には特殊な配色を適用し、それ以外の対象物はすべて緑色にしています。
Swift
let mapView = GMSMapView(frame: .zero, mapID: GMSMapID(identifier: "YOUR_MAP_ID"), camera: GMSCameraPosition(latitude: 40.7, longitude: -74.0, zoom: 12))

let layer = mapView.datasetFeatureLayer(of: "YOUR_DATASET_ID")

// Define a polygon style with fill and stroke.
// Apply the style to the datasets features.
layer.style = { feature in
  switch(feature.datasetAttributes["typecategory"]){
    case "Undeveloped"  :
      let style = MutableFeatureStyle()
      style.fillColor = .blue.withAlphaComponent(0.3);
      style.strokeColor = .blue;
      style.strokeWidth = 2.0;
      return style
    case "Parkway"  :
      let style = MutableFeatureStyle()
      style.fillColor = .red.withAlphaComponent(0.3);
      style.strokeColor = .red;
      style.strokeWidth = 2.0;
      return style
    default :
      let style = MutableFeatureStyle()
      style.fillColor = .green.withAlphaComponent(0.3);
      style.strokeColor = .green;
      style.strokeWidth = 2.0;
      return style
  }
}
Objective-C
GMSMapView *mapView = [GMSMapView mapWithFrame:CGRectZero mapID:[GMSMapID mapIDWithIdentifier:@"MAP_ID"] camera:[GMSCameraPosition cameraWithLatitude: 40.7 longitude: -74.0 zoom:12]];

GMSDatasetFeatureLayer *layer = [mapView datasetFeatureLayerOfDatasetID:@"YOUR_DATASET_ID"];

// Define a polygon style with fill and stroke.
// Apply the style to the datasets features.
layer.style = ^(GMSDatasetFeature *feature) {
  NSString *attrib = feature.datasetAttributes[@"typecategory"];
  if ([attrib isEqualToString:@"Undeveloped"]) {
        GMSMutableFeatureStyle *style = [GMSMutableFeatureStyle style];
        style.fillColor = [[UIColor blueColor] colorWithAlphaComponent:0.3];
        style.strokeColor = [UIColor blueColor];
        style.strokeWidth = 2.0;
        return style;
  } else if([attrib isEqualToString:@"Parkway"]) {
        GMSMutableFeatureStyle *style = [GMSMutableFeatureStyle style];
        style.fillColor = [[UIColor redColor] colorWithAlphaComponent:0.3];
        style.strokeColor = [UIColor redColor];
        style.strokeWidth = 2.0;
        return style;
  } else {
        GMSMutableFeatureStyle *style = [GMSMutableFeatureStyle style];
        style.fillColor = [[UIColor greenColor] colorWithAlphaComponent:0.3];
        style.strokeColor = [UIColor greenColor];
        style.strokeWidth = 2.0;
        return style;
    }
  };
ポリライン データのスタイル設定例
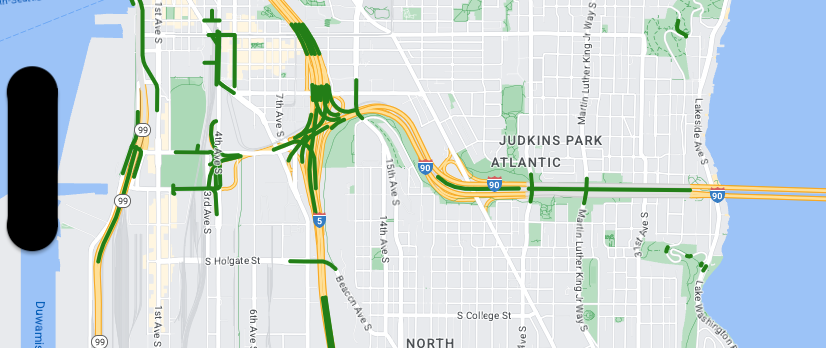
この例では、ポリライン ジオメトリ ベースのデータ対象物をスタイル設定する際のアプローチを示します。

データセットについて
この例で使用しているのは、シアトル近郊の橋を表示するデータセットです。次のコードは、データセットの GeoJSON ファイルから、代表的な対象物エントリを 1 つ抜粋したものです。
{
  "type": "Feature",
  "properties": {
      "OBJECTID": 1,
      "COMPTYPE": 66,
      "COMPKEY": 515774,
      "HANSEGKEY": 489781,
      "UNITID": "BRG-935",
      "UNITTYPE": " ",
      "BRGUNITID": "BRG-935",
      "UNITDESC_BRG": "YALE AVE BR REV LANE OC                                                                                                                                                                                                                                        ",
      "UNITDESC_SEG": "HOWELL ST ON RP BETWEEN HOWELL ST AND I5 SB                                                                                                                                                                                                                    ",
      "INSTDATE": null,
      "EXPDATE": null,
      "STATUS": " ",
      "STATUSDT": null,
      "CONDITION": " ",
      "CONDDT": null,
      "OWN": " ",
      "LSTVERIFY": null,
      "MAINTBY": " ",
      "ADDBY": "GARCIAA",
      "ADDDTTM": "2010-01-21T00:00:00Z",
      "MODBY": null,
      "MODDTTM": null,
      "BR_NBR": 935,
      "BR_CODE": " 935",
      "BR_TYPE": "ST",
      "BR_NAME": "YALE AVE BR REV LANE OC",
      "BR_FACILITIES": "YALE AVE-SR 5 ON RAMP",
      "BR_FEATURES": "SR 5 REV LANE",
      "BR_RATING": 0,
      "BR_INSET": 1,
      "BR_GEO": "DT",
      "BR_OWNER": "DOT",
      "BR_OWNER_NAME": "State of Washington",
      "GEOBASID": 0,
      "XGEOBASID": 0,
      "GISSEGKEY": 489781,
      "EARTHQUAKE_RESPONSE_TEAM": " ",
      "SHAPE_Length": 220.11891836147655
  },
  "geometry": {
      "type": "LineString",
      "coordinates": [
          [
              -122.329201929090928,
              47.616910448708538
          ],
          [
              -122.329206483407461,
              47.616976719821004
          ],
          [
              -122.32921802149356,
              47.617042137515213
          ],
          [
              -122.329236413912909,
              47.617105967923777
          ],
          [
              -122.329261454336034,
              47.617167494985758
          ],
          [
              -122.329292861855023,
              47.617226028479571
          ],
          [
              -122.329330284134699,
              47.617280911766009
          ],
          [
              -122.329373301365223,
              47.617331529154569
          ],
          [
              -122.329421430971635,
              47.617377312810319
          ],
          [
              -122.329474133027375,
              47.617417749124023
          ],
          [
              -122.32953081631139,
              47.617452384473893
          ]
      ]
  }
},
ポリライン データ対象物のスタイル設定
次のスニペットでは、同じスタイルをすべてのデータ対象物に直接適用しています。
Swift
// Define a style with green fill and stroke.
// Apply the style to the datasets features.
layer.style = { feature in
  let style = MutableFeatureStyle()
  style.fillColor = .green.withAlphaComponent(0.5);
  style.strokeColor = [UIColor greenColor];
  style.strokeWidth = 2.0;
  return style
}
Objective-C
// Define a style with green fill and stroke.
// Apply the style to the datasets features.
layer.style = ^(GMSDatasetFeature *feature) {
  GMSMutableFeatureStyle *style = [GMSMutableFeatureStyle style];
  style.fillColor = [[UIColor greenColor] colorWithAlphaComponent:0.5];
  style.strokeColor = [UIColor greenColor];
  style.strokeWidth = 2.0;
  return style;
};
